
Set up Kubernetes scaling via Prometheus & Custom Metrics
Learn how to scale Kubernetes workloads based on custom Prometheus metrics using the Prometheus Adapter and Horizontal Pod Autoscaler
Written by:
Published on:
May 9, 2025Last updated on:
Mar 23, 2026This blog is part of our Horizontal Pod Autoscaling series, we recommend reading the rest of the posts in the series:
- Introduction to Horizontal Pod Autoscaling in Kubernetes
- How to use Custom & External Metrics for Kubernetes HPA
- Set up Kubernetes scaling via Prometheus & Custom Metrics
- Leveraging Kubernetes HPA and Prometheus Adapter
By default, Kubernetes HPAs support CPU and memory-based scaling via the resource metrics API. But what if you want to scale on more application-specific signals like HTTP request rates, queue lengths, or latency?
That’s where custom metrics come in, and to use them effectively, you’ll need the Prometheus Metrics Adapter. This adapter acts as a bridge between your Prometheus server and the Kubernetes Custom & External Metrics API.
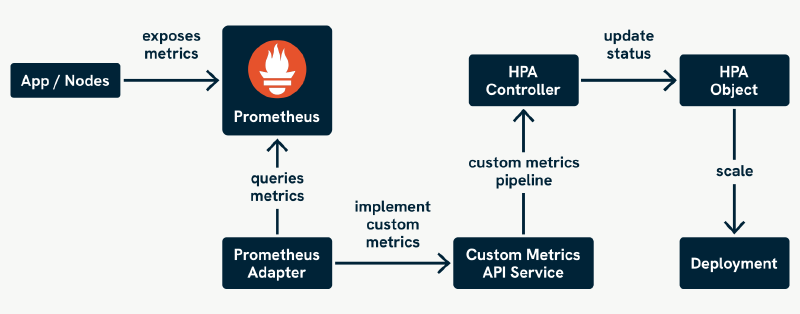
As shown above, the Prometheus Adapter queries Prometheus for metrics exposed by your applications and makes them available to the Kubernetes API. The HPA then uses these metrics to scale your workloads based on business-specific signals.
In this post, we’ll walk through how to install and configure the Prometheus Adapter using Helm, look into the API and permissions it relies on, and wrap up with some tips for debugging common issues. By the end, you’ll be well-equipped to start scaling your workloads on the metrics that matter most to your business.
Why Use Prometheus for Custom & External Metrics?
Prometheus is one of the most widely adopted monitoring systems in the Kubernetes ecosystem, thanks to its rich feature set and native integration:
- Kubernetes-native integration: Auto-discovers and scrapes metrics from your pods, services, and nodes.
- Powerful query language (PromQL): Ideal for expressing business logic in your scaling decisions.
- Scalability: Supports federation and external storage integrations.
- Vibrant ecosystem: Extensive exporter support and documentation.
How the Prometheus Adapter Uses the Custom & External Metrics API
Kubernetes supports two distinct APIs for enabling autoscaling on non-resource metrics:
Custom Metrics API (custom.metrics.k8s.io)
This API is used when metrics are associated with Kubernetes objects like pods, deployments, or namespaces. It’s the primary API exposed by the Prometheus Adapter by default.
Examples of object-based metrics:
- HTTP request rate per pod.
- Queue length per deployment.
- Latency per namespace.
These metrics:
- Are queried from Prometheus.
- Must include Kubernetes object labels (such as
pod,namespace,deployment). - Are referenced in HPAs using object selectors.
External Metrics API (external.metrics.k8s.io)
This API is used for metrics not directly tied to Kubernetes objects, such as values from cloud services or third-party APIs.
Examples of external metrics:
- AWS SQS queue depth.
- Stripe payment volume.
- API rate limits from a third-party service.
These metrics:
- Do not require Kubernetes object labels.
- Are referenced in HPAs by metric name only.
- Are useful for scaling based on external system behaviour.
The Prometheus Adapter can expose external metrics, but this functionality is not enabled by default.
To enable external metrics support in the Prometheus Adapter:
- Define rules under
.Values.rules.externalin yourvalues.yaml - Ensure that the
external.metrics.k8s.ioAPIService is enabled (this can be handled by the Helm chart if external rules are provided)
This makes the Prometheus Adapter flexible enough to handle both internal (Kubernetes object-based) and external metrics in a unified setup.
You do not need a separate adapter for external metrics if you’re using Prometheus and configure it accordingly.
If your use case only involves external metrics and you’re not already using Prometheus, a dedicated adapter (such as Google Cloud Monitoring) might still be a simpler option. But for most Kubernetes environments where Prometheus is already present, the Prometheus Adapter is fully capable of covering both use cases.
Helm/YAML Setup of Prometheus Adapter
The Prometheus Adapter is best installed via Helm. Helm provides a package manager-like experience for Kubernetes, helping you keep your deployments consistent and configurable. The Prometheus Adapter is available through the prometheus-community Helm chart repository.
Add the Helm Repository
First, add the Helm repo that hosts the Prometheus Adapter chart:
helm repo add prometheus-community https://prometheus-community.github.io/helm-charts
helm repo update
Install the Prometheus Adapter
Install the adapter in a dedicated namespace, often called monitoring:
kubectl create namespace monitoring
Now install the chart:
helm install prometheus-adapter prometheus-community/prometheus-adapter \
  --namespace monitoring \
  --values custom-values.yaml
Helm Chart Common Configuration
While the Prometheus Adapter Helm chart works out of the box in some setups (especially with the kube-prometheus-stack), it’s often necessary to configure a few key values to make it work correctly in your environment.
Below is a practical example values.yaml that includes the most commonly adjusted options. This setup assumes you’re using a Prometheus instance like prometheus-operated (as deployed by kube-prometheus-stack), and want to expose a metric from a test app.
Connecting to Prometheus
The adapter needs to know how to reach your Prometheus instance. If you’re using the kube-prometheus-stack, you can reference the Prometheus service directly:
# Helm chart values
prometheus:
  service:
    name: prometheus-operated
    namespace: monitoring
    port: 9090
Alternatively, if Prometheus is accessible via a stable URL (such as through an Ingress or external service), you can use:
# Helm chart values
prometheus:
  url: http://prometheus.monitoring.svc.cluster.local
Without this, the adapter cannot query Prometheus, and no metrics will be exposed to Kubernetes.
Defining Custom Metric Rules
This is the core of the adapter setup, you define which Prometheus metrics to expose, how to query them, and how to map them to Kubernetes resources.
Here’s an example to expose the flask_http_request_total counter (emitted by our test app) as a per-second rate:
rules:
  custom:
    - seriesQuery: 'flask_http_request_total{namespace!="",pod!=""}'
      resources:
        overrides:
          namespace: { resource: "namespace" }
          pod: { resource: "pod" }
      name:
        matches: "flask_http_request_total"
        as: "http_requests_per_second"
      metricsQuery: 'sum(rate(flask_http_request_total{<<.LabelMatchers>>}[2m])) by (<<.GroupBy>>)'
Ensure the metric exists in Prometheus and includes both namespace and pod labels, these are essential for mapping to Kubernetes pods.
RBAC and Service Account Setup
The adapter needs permission to watch Kubernetes resources (such as pods and namespaces) and register as an API extension.
Enable these with:
# Helm chart values
rbac:
  create: true

serviceAccount:
  create: true
  name: prometheus-adapter
If you’re deploying in a restricted cluster or need to use an existing service account, update the name accordingly.
TLS and APIService Registration
Kubernetes requires secure communication with aggregated API services. By default, the chart enables self-signed certs:
# Helm chart values
tls:
  enable: true
  caBundle: ""
- Leave caBundle empty for self-signed certificates.
- If you’re managing TLS via cert-manager or your own CA, you can supply a base64-encoded CA bundle here.
If the custom.metrics.k8s.io APIService shows a False availability status, it’s likely a TLS trust issue.
Limiting Metric Scope by Namespace
In large clusters, or for security/isolation purposes, you may want to restrict the adapter to only observe metrics from specific namespaces:
# Helm chart values
rules:
  namespaceSelector:
    matchNames:
      - custom-metrics-test
This reduces unnecessary load and avoids exposing metrics from other tenants or teams.
Testing Your Configuration
With the adapter installed and configured, it’s time to deploy a test application that exposes Prometheus metrics. We’ll then create an HPA to scale that app based on HTTP request rate.
Deploy a Test App with Metrics
We’ll use a simple Python Flask app instrumented with prometheus_flask_exporter. The image is prebuilt and available via GitHub Container Registry.
Run the following to deploy it inline:
cat <<EOF | kubectl apply -f -
apiVersion: v1
kind: Namespace
metadata:
  name: custom-metrics-test
---
apiVersion: apps/v1
kind: Deployment
metadata:
  name: test-metric-app
  namespace: custom-metrics-test
spec:
  replicas: 1
  selector:
    matchLabels:
      app: test-metric-app
  template:
    metadata:
      labels:
        app: test-metric-app
    spec:
      containers:
        - name: app
          image: ghcr.io/ukps/custom-metrics-test-app:latest
          ports:
            - containerPort: 5000
          readinessProbe:
            httpGet:
              path: /metrics
              port: 5000
            initialDelaySeconds: 5
            periodSeconds: 5
---
apiVersion: v1
kind: Service
metadata:
  name: test-metric-app
  namespace: custom-metrics-test
spec:
  selector:
    app: test-metric-app
  ports:
    - protocol: TCP
      port: 80
      targetPort: 5000
EOF
This creates a deployment and a service in the custom-metrics-test namespace.
Applying an HPA with a Custom Metric
Now apply an HPA that uses the custom metric http_requests_per_second:
cat <<EOF | kubectl apply -f -
apiVersion: autoscaling/v2
kind: HorizontalPodAutoscaler
metadata:
  name: test-metric-hpa
  namespace: custom-metrics-test
spec:
  scaleTargetRef:
    apiVersion: apps/v1
    kind: Deployment
    name: test-metric-app
  minReplicas: 1
  maxReplicas: 5
  metrics:
  - type: Pods
    pods:
      metric:
        name: http_requests_per_second
      target:
        type: AverageValue
        averageValue: "5"
EOF
This tells Kubernetes to scale up the deployment if the per-pod request rate exceeds 5 requests per second.
Simulate Load
To trigger scaling, simulate HTTP traffic to the app:
kubectl port-forward svc/test-metric-app -n custom-metrics-test 8080:80
Generate traffic:
hey -z 30s -c 10 http://localhost:8080/
Or use a browser or curl to hit it repeatedly.
Monitor Scaling
Watch the HPA in action:
kubectl get hpa -n custom-metrics-test -w
Also check the deployment:
kubectl get deploy test-metric-app -n custom-metrics-test -w
If everything is configured correctly, the number of replicas should increase once the request rate exceeds the defined threshold.
Production-Ready Tips for the Prometheus Adapter
Once your Prometheus Adapter is working with custom & external metrics and HPAs in a dev or staging environment, it’s time to consider the operational hardening and reliability improvements needed for production.
Below are some essential practices and configuration enhancements to ensure your adapter is secure, stable, and scalable in real world clusters.
Use cert-manager to Manage TLS Certificates
When Kubernetes communicates with aggregated API services (such as custom.metrics.k8s.io, served by the Prometheus Adapter), it expects secure TLS and a trusted CA (caBundle). If this isn’t configured properly, the APIService will show as Unavailable, and metrics won’t be accessible by HPAs.
Fortunately, the Prometheus Adapter Helm chart provides full cert-manager integration out of the box. When enabled, it handles:
- Creating a self-signed CA using cert-manager.
- Issuing a serving certificate for the adapter’s internal service.
- Mounting the TLS cert into the adapter pod.
- Annotating the APIServices so cert-manager injects the CA into caBundle.
Install cert-manager
If cert-manager is not already installed:
kubectl apply -f https://github.com/cert-manager/cert-manager/releases/latest/download/cert-manager.yaml
cert-manager will detect annotations and handle certificate generation and CA injection for the APIServices.
Enabling cert-manager in the Helm Chart
Just set this in your custom-values.yaml:
# Helm chart values
certManager:
  enabled: true
You don’t need to manually create a Certificate, Issuer, or patch the APIServices. The Helm chart handles it all:
- The certificate is stored in a secret like prometheus-adapter-tls.
- The volume is mounted automatically.
- The APIServices are annotated with
cert-manager.io/inject-ca-from: monitoring/prometheus-adapter-serving-cert.
This setup uses cert-manager’s built-in CA injection mechanism, trusted by the Kubernetes API server.
Install the Adapter With Production-Ready Values
helm upgrade --install prometheus-adapter prometheus-community/prometheus-adapter \
  --namespace monitoring \
  --values custom-values.yaml
Verify the APIService is Available
After installation, confirm the adapter’s APIService is properly registered and trusted:
kubectl get apiservice v1beta1.custom.metrics.k8s.io
You should see True in the AVAILABLE column.
If not, check:
kubectl describe apiservice v1beta1.custom.metrics.k8s.io
Check that the CA was injected:
kubectl get apiservice v1beta1.custom.metrics.k8s.io -o yaml | grep caBundle
You should see a populated caBundle.
Multi-Tenancy Considerations for the Prometheus Adapter
In a multi-team or multi-tenant Kubernetes environment, the Prometheus Adapter plays a critical role in enabling Horizontal Pod Autoscaling based on custom metrics. Managing it correctly is essential to ensure tenant isolation, operational scalability, and security. Below are the key considerations for managing the Prometheus Adapter in such an environment.
Deploying Per-Tenant Prometheus Adapter Instances
In some scenarios, deploying a separate Prometheus Adapter instance per tenant is the most appropriate approach. This is especially relevant when:
- Teams require complete metrics and configuration isolation.
- Tenants use separate Prometheus servers or scraping strategies.
- Custom metric formats or scaling rules differ significantly across tenants.
- Security policies mandate that metric data cannot be shared at runtime.
Benefits:
- Full control over query configuration and metric exposure per tenant.
- Reduced risk of accidental cross-tenant data leakage.
- Clear operational boundaries between teams.
How to Deploy and Manage:
- Namespace-Scoped Deployments: Deploy each Prometheus Adapter instance within the tenant’s own namespace. Each adapter queries only the Prometheus instance assigned to that tenant, and is scoped to their metrics.
- Custom ConfigMap per Tenant: Supply each instance with its own ConfigMap containing tenant-specific queries and external metric rules.
- RBAC and ServiceAccounts: Configure a dedicated ServiceAccount with scoped RBAC rules allowing only access to resources within that tenant’s namespace.
- Unique APIService Registration: If multiple adapters expose custom metrics under the same group/version (such as
custom.metrics.k8s.io/v1beta1), you’ll need to use unique API groups or run only one globally visible APIService per cluster.
In many cases, you can avoid APIService conflicts by exposing per-tenant adapters only internally, using them as backends for autoscaling within the tenant’s scope, and not registering them cluster-wide.
Isolating Metrics with Label Filters
If a shared adapter is preferred, use label-based query filters (such as filtering by namespace or team labels) in your adapter configuration to ensure metric queries return only tenant-relevant data.
# Helm chart values
extraArguments:
  - --metric-labels=namespace,team
  - --metric-filter="namespace={{.namespace}}"
This approach works well when tenants can trust a shared infrastructure but require visibility only into their own metrics.
Operational Governance
If running multiple adapter instances, consider:
- Centralising logs and metrics for observability across adapter instances.
- Naming conventions for easier traceability (such as prometheus-adapter-team-a, prometheus-adapter-tenant-x).
- Ensuring certificate issuance and API registration (if required) are automated as part of onboarding/offboarding tenants.
Debugging Adapter Issues
Even with Helm, setting up the adapter can be somewhat tricky. Here are a few common problems and how to diagnose them.
Custom Metrics Not Found
If you run kubectl get --raw "/apis/custom.metrics.k8s.io/v1beta1" | jq . and get an empty list, it means no metrics are being served.
Check the following:
- Your Prometheus metric exists.
- The seriesQuery matches your metric correctly.
- Labels like namespace and pod are present.
Use the Prometheus expression browser to test your queries and label filters before plugging them into the adapter.
APIService Status is False
Run kubectl describe apiservice v1beta1.custom.metrics.k8s.io.
Look for TLS or connectivity issues. Often, Kubernetes can’t trust the adapter’s certificate.
Fixes include:
- Ensuring the
caBundlefield is populated correctly. - Using valid or signed serving certs.
- Installing
cert-managerto automate certificate provisioning.
Adapter Fails to Start
Run kubectl logs -n monitoring deploy/prometheus-adapter
Common issues include:
- Invalid YAML syntax in your metric rules.
- Mistyped PromQL expressions.
- Prometheus unreachable from the adapter.
HPA Not Scaling
Make sure:
- The metric is available via the Custom or External Metrics API.
- The metric value is valid (non-zero).
- The HPA target is reasonable for your expected load.
Wrapping Up
The Prometheus Adapter is a crucial enabler for custom & external metrics-based scaling in Kubernetes. When configured properly, it unlocks the ability to scale applications based on rich operational data, not just CPU or memory usage.
In this post, we walked through how to install the adapter using Helm, set up metric rules, configure the necessary permissions and API integration, and debug common problems. It’s a somewhat intricate setup, but once running, it gives you powerful capabilities for fine-tuned autoscaling.
In the next post, we’ll look at how to define Horizontal Pod Autoscalers that consume these custom & external metrics, complete with real world examples like queue depth and request latency.
Extra Links
This blog is part of our Horizontal Pod Autoscaling series, we recommend reading the rest of the posts in the series:
- Introduction to Horizontal Pod Autoscaling in Kubernetes
- How to use Custom & External Metrics for Kubernetes HPA
- Set up Kubernetes scaling via Prometheus & Custom Metrics
- Leveraging Kubernetes HPA and Prometheus Adapter