
Kubernetes Autoscaling with Datadog: HPA or KEDA?
A practical comparison of HPA with Datadog Cluster Agent versus KEDA for Kubernetes autoscaling, with working configurations and a decision guide.
Written by:
Published on:
Last updated on:
This blog is part of our Kubernetes Autoscaling with Datadog series, we recommend reading the rest of the posts in the series:
The previous posts in this series have focused on two specific approaches.
Post 1 and Post 2 covered the Datadog Cluster Agent acting as an External Metrics Provider, with Kubernetes’ native Horizontal Pod Autoscaler consuming those metrics to drive scaling decisions.
Post 3 introduced the DatadogPodAutoscaler, Datadog’s own autoscaling resource, which consolidates horizontal and vertical scaling into a single controller. Both approaches are well-supported and production-proven; the right default depends on the workload and what the team operating it needs from its autoscaler.
Neither, however, addresses one particular requirement: scaling a workload down to zero replicas when there is genuinely no work to do.
That is where Kubernetes Event-Driven Autoscaling, better known as KEDA, enters the picture. KEDA is a CNCF project that ships with a native Datadog scaler, supports scale-to-zero out of the box, and handles multi-source trigger composition in ways the standard HPA cannot. For teams already running KEDA for other scalers, or those with workloads that genuinely need to drop to zero replicas during idle periods, it is worth understanding the differences properly rather than defaulting to one approach without thinking through the others.
This post focuses on the Datadog scaler specifically and the architectural trade-offs between the two approaches. Readers who are new to KEDA will find the Introducing KEDA and Getting Started with KEDA posts in our KEDA series useful background on the concepts and CRDs referenced here.
How Do HPA and KEDA Architectures Differ?
Before reaching for configuration examples, it helps to understand what each approach is doing under the hood, because the architectural differences explain most of the practical trade-offs.
HPA + Datadog Cluster Agent
In this model, the Datadog Cluster Agent registers itself as a Kubernetes External Metrics Provider by implementing the external.metrics.k8s.io API. The Kubernetes HPA controller queries this API on its evaluation cycle (every 15 seconds by default), retrieves the current metric value from Datadog, and adjusts the workload’s replica count accordingly.
The metric query itself is either embedded directly in the HPA spec (inline mode), or defined separately as a DatadogMetric custom resource and referenced by name. Either way, the Cluster Agent is the component that calls the Datadog API, caches the result, and serves it to the HPA on demand.
The Cluster Agent polls Datadog every 30 seconds by default, and the HPA controller polls the Cluster Agent every 15 seconds. In practice, this means the autoscaler is working with metric data that is up to 30 to 45 seconds old before any stabilisation windows are applied.
KEDA + Datadog Scaler
KEDA installs as a separate operator in the cluster. It introduces two main components: the keda-operator, which acts as a controller for ScaledObject resources, and the keda-operator-metrics-apiserver, which implements the same External Metrics API that the HPA controller queries.
When a ScaledObject is defined, KEDA creates and manages an HPA on the team’s behalf, handles the metric retrieval from the external source itself, and feeds values into its own metrics API server for the HPA to consume.
The Datadog-specific scaler within KEDA calls the Datadog metrics API directly using an API key and app key, on a configurable polling interval.
A ScaledObject can define multiple triggers from different sources simultaneously, and KEDA evaluates them independently. This is where KEDA diverges most clearly from the native HPA: multi-source scaling is a first-class concept in KEDA’s design, rather than a side effect of the HPA’s “scale to the most demanding metric” behaviour.
The other significant difference is scale-to-zero. The native HPA enforces a minimum of one replica. KEDA removes this constraint; when all triggers report zero, or below a configurable activation threshold, KEDA can scale a workload to zero replicas entirely.
With both architectures in view, the structural difference is clearest when they are placed side by side:
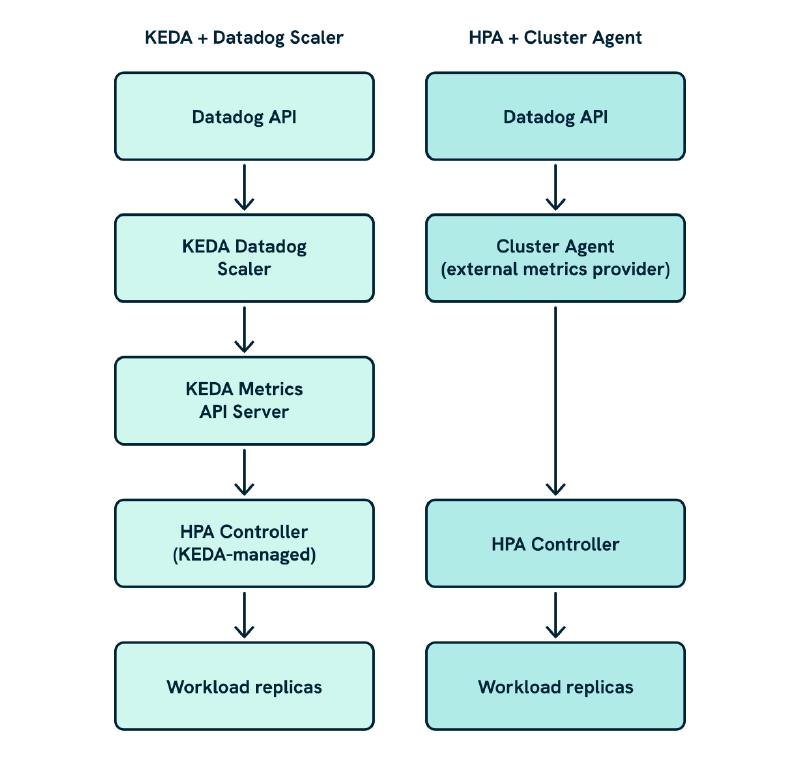
The Cluster Agent is a single component sitting between Datadog and the HPA; KEDA introduces two components in that same position, the scaler that calls Datadog and the metrics API server that the HPA queries. That extra hop is the reason the External Metrics Provider constraint exists: both the Cluster Agent and KEDA’s metrics server implement the same external.metrics.k8s.io interface, and Kubernetes only accepts one registration.
Installing KEDA
KEDA is deployed separately from the Datadog Cluster Agent. If the Cluster Agent is already running for other purposes, KEDA will sit alongside it without conflict, provided both are not running as External Metrics Providers simultaneously.
The Getting Started with KEDA tutorial covers the full installation in detail, including namespace RBAC requirements and available configuration options.
The One External Metrics Provider Constraint
Kubernetes allows only one registered External Metrics Provider per cluster. Both the Datadog Cluster Agent (when metricsProvider.enabled: true) and KEDA’s metrics API server implement this interface. Running both simultaneously will cause one registration to fail.
This is a genuine constraint. Options for resolving it are covered in this blog post’s FAQ. For most teams, the practical choice is to pick one approach per cluster.
With that understood, it is worth verifying the API service registration before proceeding to any ScaledObject configuration:
kubectl get apiservice v1beta1.external.metrics.k8s.io
The SERVICE column should reference the KEDA metrics API server rather than the Datadog Cluster Agent. If both have been enabled at some point and the entry looks inconsistent, inspecting the API service directly will surface the conflict:
kubectl describe apiservice v1beta1.external.metrics.k8s.io
Configuring the Datadog Scaler in KEDA
KEDA authenticates to external sources through a TriggerAuthentication resource that references a Kubernetes Secret. The Getting Started tutorial covers the full authentication model, including cluster-scoped variants and external secret store integrations. For the Datadog scaler, authentication requires an API key and app key; create the secret first:
kubectl create secret generic datadog-keda-secret \
  --namespace my-app \
  --from-literal=apiKey=<DATADOG_API_KEY> \
  --from-literal=appKey=<DATADOG_APP_KEY>
Then define the TriggerAuthentication:
apiVersion: keda.sh/v1alpha1
kind: TriggerAuthentication
metadata:
  name: datadog-trigger-auth
  namespace: my-app
spec:
  secretTargetRef:
    - parameter: apiKey
      name: datadog-keda-secret
      key: apiKey
    - parameter: appKey
      name: datadog-keda-secret
      key: appKey
This TriggerAuthentication is referenced from each ScaledObject and can be reused across multiple definitions in the same namespace. Scope secrets by namespace rather than creating a single cluster-wide resource; a leaked app key already carries significant blast radius without giving every namespace the same credentials.
A Complete End-to-End Example: Nginx Request Rate
We will use the Nginx request rate metric, which should already be flowing into Datadog from the earlier posts, to walk through a full deployment and verify KEDA end to end before moving to more advanced patterns.
Deploy the ScaledObject
apiVersion: keda.sh/v1alpha1
kind: ScaledObject
metadata:
  name: nginx-scaledobject
  namespace: my-app
spec:
  scaleTargetRef:
    name: nginx
  minReplicaCount: 1
  maxReplicaCount: 10
  cooldownPeriod: 300
  triggers:
    - type: datadog
      metricType: AverageValue
      metadata:
        query: "avg:nginx.net.request_per_s{service:frontend,env:production}"
        queryValue: "200"
        age: "120"
      authenticationRef:
        name: datadog-trigger-auth
A few things are worth unpacking here.
The age parameter tells KEDA to retrieve metric data from the past 120 seconds; KEDA’s default is 90 seconds, but for metrics sourced from integrations with some collection latency (like the Nginx check running through the Datadog Agent), a slightly wider window produces more stable values. The metricType: AverageValue setting divides the query result by the current replica count, which is the right behaviour for a per-pod rate metric.
Verify the ScaledObject Is Active
Once deployed, KEDA creates and manages an HPA on the workload’s behalf. Confirm that both resources are present:
# Check the ScaledObject status
kubectl describe scaledobject nginx-scaledobject -n my-app
The output will include a Status section. Look specifically for the Active and Ready conditions:
Conditions:
  Type            Status  Reason              Message
  ----            ------  ------              -------
  AbleToScale     True    SucceededGetScale   ...
  ScalingActive   True    ValidTriggerFound   Scaling is performed because triggers are active
  ScalingLimited  False   DesiredWithinRange  ...
If ScalingActive shows False with a reason of NoValidTriggersFound, the most likely cause is an authentication problem or a Datadog query that is returning no data. Checking the KEDA operator logs is the next step:
kubectl logs -n keda deploy/keda-operator --since=5m
Look for lines referencing the ScaledObject name. KEDA will log the specific error from the Datadog API response if the query itself is invalid, which is more informative than the condition message on the resource.
Also confirm that KEDA has created the underlying HPA:
kubectl get hpa -n my-app
The HPA name will be prefixed with keda-hpa-. If it is not present, the ScaledObject is not yet active and the KEDA operator logs will explain why.
For Datadog-side verification, first confirm that the query returns sensible values directly in the Datadog Metrics Explorer before assuming there is a Kubernetes-side problem. Common error messages from the KEDA Datadog scaler and what they indicate are covered in the FAQ below.
Generate Load and Observe Scaling
Port-forward the Nginx service and generate sustained traffic:
kubectl port-forward svc/nginx -n my-app 8080:80
hey -z 60s -c 20 http://localhost:8080/
Watch the ScaledObject and the underlying Deployment simultaneously:
kubectl get scaledobject nginx-scaledobject -n my-app -w
kubectl get deploy nginx -n my-app -w
The READY and ACTIVE columns on the ScaledObject will reflect the current trigger state. Allow for 30 to 60 seconds after traffic begins; the KEDA operator polls Datadog every 30 seconds by default, and there is the usual Datadog Agent collection and ingestion latency on top of that.
Example 2: SQS Queue Depth with Scale-to-Zero
This is where KEDA’s design pays off most clearly. A worker Deployment that processes jobs from an SQS queue is a natural candidate for scale-to-zero: when the queue is empty, there is no work to do, and running even a single idle worker pod is pure waste.
apiVersion: keda.sh/v1alpha1
kind: ScaledObject
metadata:
  name: video-worker-scaledobject
  namespace: video
spec:
  scaleTargetRef:
    name: video-transcoder
  minReplicaCount: 0
  maxReplicaCount: 20
  cooldownPeriod: 600
  triggers:
    - type: datadog
      metricType: Value
      metadata:
        query: "avg:aws.sqs.messages_visible{queuename:video-processing,env:prod}.rollup(avg, 60)"
        queryValue: "50"
        activationQueryValue: "1"
        age: "120"
        timeWindowOffset: "30"
      authenticationRef:
        name: datadog-trigger-auth
Two parameters here are specific to the scale-to-zero pattern.
activationQueryValue: "1" establishes a dead-band threshold; the scaler only becomes active once the metric exceeds 1, keeping the workload at zero until there is at least one visible message in the queue. The FAQ below explains what happens if this is omitted.
The timeWindowOffset: "30" adds a 30-second delay to the query window, accounting for CloudWatch metric propagation latency.
The cooldownPeriod of 600 seconds (ten minutes) controls how long KEDA waits after the metric drops to zero before scaling the workload back down to zero replicas. The FAQ below explains how it relates to scaleDown.stabilizationWindowSeconds.
The native HPA cannot replicate this configuration. Setting minReplicas: 0 on a native HPA is not supported; the minimum is 1.
Example 3: Multi-Source Triggers
KEDA’s multi-trigger support is more composable than the HPA’s multi-metric behaviour. Each trigger is independently evaluated, and KEDA scales to whichever trigger demands the most replicas. Trigger types can be mixed freely, combining Datadog metrics with native Kubernetes resource metrics, Kafka topic lag, Redis list length, or any other supported source.
The KEDA tutorial series has worked examples for the Prometheus scaler and Redis List scaler if those trigger types are relevant.
Here is a configuration that combines Nginx request rate with SQS queue depth as independent triggers:
apiVersion: keda.sh/v1alpha1
kind: ScaledObject
metadata:
  name: transcoder-multi-trigger
  namespace: video
spec:
  scaleTargetRef:
    name: transcoder
  minReplicaCount: 1
  maxReplicaCount: 20
  cooldownPeriod: 300
  triggers:
    - type: datadog
      metricType: AverageValue
      metadata:
        query: "avg:nginx.net.request_per_s{service:transcoder,env:production}"
        queryValue: "250"
        age: "90"
      authenticationRef:
        name: datadog-trigger-auth
    - type: datadog
      metricType: Value
      metadata:
        query: "avg:aws.sqs.messages_visible{queuename:video-processing,env:prod}.rollup(avg, 60)"
        queryValue: "100"
        activationQueryValue: "1"
        age: "120"
        timeWindowOffset: "30"
      authenticationRef:
        name: datadog-trigger-auth
This is functionally similar to the multi-metric HPA from Post 2, with the same “scale to the most demanding signal” semantics. The meaningful difference is in composability: a third trigger of a completely different type, such as a Kafka consumer group lag check, could be added without any structural changes to the configuration.
That kind of heterogeneous trigger composition is not something the Cluster Agent’s External Metrics Provider can support, because it only accepts Datadog-sourced metrics.
Tuning and Behaviour
KEDA’s ScaledObject does not expose a behavior field directly; instead, it passes behaviour configuration through to the underlying HPA it manages. HPA-compatible behaviour settings are provided in the advanced section:
spec:
  advanced:
    horizontalPodAutoscalerConfig:
      behavior:
        scaleUp:
          stabilizationWindowSeconds: 30
          policies:
            - type: Percent
              value: 50
              periodSeconds: 60
        scaleDown:
          stabilizationWindowSeconds: 300
This gives the same tuning surface as a native HPA.
The cooldownPeriod on the ScaledObject itself is specifically for the scale-to-zero / scale-from-zero transition; the behavior block governs scaling behaviour once the workload has at least one replica.
One tuning consideration specific to KEDA is the pollingInterval. By default, KEDA evaluates triggers every 30 seconds. For workloads requiring faster reactions, this can be reduced:
spec:
  pollingInterval: 15
Shorter polling intervals mean more frequent Datadog API calls, which has cost and rate limit implications if there are many ScaledObject resources. Each ScaledObject trigger generates independent API calls; in a cluster with many workloads and multiple triggers each, this adds up quickly.
The Cluster Agent approach amortises Datadog API calls more efficiently at scale, since all metric queries flow through a single component that caches results centrally. This is one of the more meaningful operational differences between the two approaches at larger scales.
Where Does DatadogPodAutoscaler Fit?
The DatadogPodAutoscaler and KEDA solve different parts of the problem.
The DatadogPodAutoscaler is designed for continuously-running workloads where Datadog manages both horizontal replica count and vertical resource sizing from a single resource definition. It integrates tightly with Datadog’s own analysis of workload history and cost data, but it has two constraints that KEDA does not: it requires Remote Configuration connectivity, and it cannot scale to zero replicas.
KEDA is designed for event-driven scaling, where the primary requirement is reacting to external triggers, composing signals from heterogeneous sources, or reaching zero replicas during genuinely idle periods. It does not offer vertical right-sizing.
With those differences in mind, the three approaches can be compared directly:
| HPA + Cluster Agent | Datadog Pod Autoscaler | KEDA | |
|---|---|---|---|
| Horizontal scaling | ✅ | ✅ | ✅ |
| Vertical right-sizing | ❌ | ✅ | ❌ |
| Scale to zero | ❌ | ❌ | ✅ |
| Trigger sources | Datadog metrics | Datadog metrics | Any KEDA scaler |
| Remote Configuration required | ❌ | ✅ | ❌ |
| Separate operator required | ❌ | ❌ | ✅ |
Post 5 in this series works through the decision across concrete workload archetypes, which is the most useful frame for choosing between them.
Choosing Between the HPA + Cluster Agent Approach and KEDA
Do any workloads need to scale to zero? If yes, KEDA is the answer. The native HPA cannot do this, and no configuration of the Cluster Agent changes that. For worker-style workloads with intermittent load, this is a hard requirement that resolves the decision immediately
Is the Cluster Agent already deployed and providing external metrics? If yes, adding KEDA requires a decision about the External Metrics Provider conflict. Either existing HPAs must be migrated to KEDA ScaledObject resources, or KEDA must be run only in clusters where the Cluster Agent metrics provider is disabled. This is not an insurmountable problem, but the migration needs to be planned carefully.
How many workloads will be autoscaled? KEDA makes independent Datadog API calls per trigger per ScaledObject. At scale, this can become costly in terms of API rate limits and Datadog usage. The Cluster Agent caches metric results centrally, which is more efficient in clusters with many autoscaled workloads. If dozens of workloads are being scaled on Datadog metrics, the Cluster Agent approach is easier to govern from an API usage perspective.
Does the team already run KEDA for other scalers? If so, adding the Datadog scaler is low-friction and gives a single resource model across all event-driven autoscaling. If not, the additional operator, CRDs, and observability surface are overhead to weigh against the benefits.
Is GitOps and auditability a concern? Both approaches are GitOps-compatible and produce plain Kubernetes custom resources. Neither has a meaningful advantage here, though the Cluster Agent’s separation of metric definition from HPA configuration maps well to teams that want to manage metric definitions centrally.
Do any workloads need a dead-band threshold to prevent scale-up from noisy signals? KEDA’s activationQueryValue handles this natively; the HPA has no direct equivalent.
Or, in short:
- Scale-to-zero required: Use KEDA
- Already running KEDA for other scalers: Use KEDA
- Large number of Datadog-metric-driven workloads, and no scale-to-zero is needed: Use Cluster Agent
- Existing HPA investments with
DatadogMetricCRDs: Use Cluster Agent, unless migrating - Horizontal and vertical right-sizing from one resource: Use
DatadogPodAutoscaler
Wrapping Up
For clusters without existing autoscaling infrastructure, the Cluster Agent approach from the earlier posts is a reasonable starting point; it has a lighter dependency footprint and integrates naturally with DatadogMetric CRDs. KEDA is the right choice once scale-to-zero or multi-source trigger composition becomes a genuine requirement.
Post 5 takes the tools covered across this series and works through a set of concrete workload archetypes, providing a practical frame for deciding which approach fits which situation.
The KEDA documentation covers the full set of Datadog scaler parameters, and the Datadog Cluster Agent autoscaling guide remains the authoritative reference for the HPA path.
Frequently Asked Questions
Can I run KEDA and the Datadog Cluster Agent metrics provider in the same cluster?
No. Kubernetes allows only one registered External Metrics Provider per cluster. Both the Datadog Cluster Agent (when metricsProvider.enabled: true) and KEDA’s metrics API server implement the external.metrics.k8s.io interface, and only one registration can be active at a time.
When both are needed, the practical options are:
- Disable the Cluster Agent metrics provider and migrate all existing external metric HPAs to KEDA
ScaledObjectresources. - Run KEDA only in clusters where the Cluster Agent metrics provider is not enabled.
- Use KEDA’s alternative Cluster Agent integration mode, where KEDA queries metrics through the Cluster Agent’s External Metrics API rather than calling Datadog directly; this sidesteps the conflict but is documented as experimental and we would not use it in production without thorough testing.
What do KEDA’s common Datadog scaler error messages mean?
KEDA logs errors from the Datadog scaler to the keda-operator pod. The most frequent ones during initial setup:
"error executing query": the Datadog API returned an error. Check the query syntax in the Metrics Explorer first, then confirm the app key has theMetrics Readpermission."query returned more than 1 series": the query is returning multiple time series where a single value is expected. Add aqueryAggregatorparameter to resolve them:
metadata:
  query: "avg:nginx.net.request_per_s{env:production}"
  queryValue: "200"
  queryAggregator: "max"
Without this, KEDA will refuse to act on the metric entirely. It is worth checking for this during initial setup before the ScaledObject reaches production.
"no data returned for the query": the query is syntactically valid but returned an empty series. This is almost always a tag scoping issue; confirm the tags in the query match what Datadog is actually reporting for the target service.
What is the difference between cooldownPeriod and scaleDown.stabilizationWindowSeconds?
These two settings operate at different levels and both apply to workloads configured with minReplicaCount: 0.
cooldownPeriod is a KEDA-level setting on the ScaledObject. It controls how long KEDA waits after all triggers report zero before scaling the workload down to zero replicas. It governs only the transition to and from zero.
scaleDown.stabilizationWindowSeconds is an HPA-level setting, passed through via the advanced.horizontalPodAutoscalerConfig.behavior block. It controls how conservatively the HPA scales down once the workload already has at least one replica, and has no effect on the scale-to-zero path.
For a workload with minReplicaCount: 0, both are relevant: cooldownPeriod controls when the workload drops to zero, and stabilizationWindowSeconds controls how it behaves between non-zero replica counts.
What happens if I omit activationQueryValue?
Without activationQueryValue, KEDA treats any non-zero metric value as a signal to scale up. For workloads with minReplicaCount: 0, a very small non-zero value from a noisy or inconsistent metric can trigger an unnecessary scale-up from zero replicas. Setting activationQueryValue establishes a dead-band threshold: the scaler only becomes active once the metric exceeds that value, preventing spurious activations during idle periods.
This blog is part of our Kubernetes Autoscaling with Datadog series, we recommend reading the rest of the posts in the series: