
Kubernetes Autoscaling with Datadog External Metrics
Learn how to scale Kubernetes deployments using Datadog external metrics with the Horizontal Pod Autoscaler (HPA)
Written by:
Published on:
Last updated on:
This blog is part of our Kubernetes Autoscaling with Datadog series, we recommend reading the rest of the posts in the series:
Kubernetes autoscaling often gets reduced to CPU and memory. And honestly, that is fine, until it is not.
Maybe your application pulls tasks from a queue. Maybe traffic spikes do not translate into CPU pressure, because the bottleneck is downstream. Maybe you have instrumented your service with meaningful application metrics and you would rather scale on those than on infrastructure side-effects.
That is where external metrics come in. Instead of scaling on what the node observes, you scale on what actually matters: queue depth, request volume, or signals flowing in from cloud services. In the previous post in this series, we covered how to install and configure the Datadog Cluster Agent to serve external metrics to your HPAs. Here, we will put that to work with concrete examples: Nginx request rate, SQS queue depth, and combining both signals in a single autoscaler. We will also cover tuning, verification, and a few production gotchas worth knowing about before you ship this.
What kind of metric are we dealing with?
If you have read Post 1 in this series, you will be familiar with the distinction between custom and external metrics. To recap: Datadog uses the External Metrics API exclusively, surfacing signals from outside the cluster rather than metrics tied to specific Kubernetes objects. The full explanation of how this fits into the Kubernetes metrics API landscape is in Post 1, so we will not repeat it here.
What is worth establishing before we jump into the examples, though, is how metric timing affects autoscaler behaviour. This is the detail that catches people out most often in production and that deserves more attention than it typically gets.
Understanding metric latency and what it means for your autoscaler
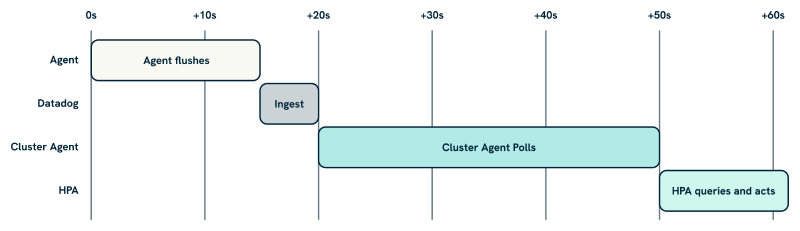
When the Cluster Agent retrieves a metric from Datadog, it is not getting a live reading. There are several delays stacked on top of each other, and understanding them helps you set sensible expectations for how quickly your autoscaler can react.
The Datadog Agent collects and flushes metrics every 15 seconds by default. Those metrics travel to the Datadog backend, where ingestion adds a small but non-zero delay. The Cluster Agent then polls Datadog every 30 seconds to refresh its local cache; Kubernetes also queries the Cluster Agent every 30 seconds by default. In practice, by the time the HPA acts on a metric value, that value is typically 30 to 60 seconds old. For most workloads driven by application-level metrics, this is entirely acceptable.
AWS CloudWatch is a different matter. SQS metrics like aws.sqs.messages_visible are collected via Datadog’s AWS integration, which polls CloudWatch every 10 minutes by default. On top of that, CloudWatch itself can add a further 5 to 10 minutes of propagation delay before a metric value is available. The realistic figure is 15 to 20 minutes of end-to-end latency between a change in queue depth and the HPA seeing a stable, actionable value.
This is not a reason to avoid CloudWatch-sourced metrics; queue depth is still one of the most useful autoscaling signals available. However, it does shape how you should configure your rollup windows and stabilisation periods. For a signal that is already 90 seconds old by the time the autoscaler sees it, a 30-second stabilisation window is not doing much. We will come back to this in the tuning section.
Before we dive in: what you will need
- A Kubernetes cluster running v1.26 or later (recommended for production use).
- The Datadog Cluster Agent installed with the external metrics server enabled. If you have not done this yet, Post 1 walks through both Helm modes in detail.
- Metrics from your application or infrastructure already flowing into Datadog.
- The Cluster Agent configured with appropriate RBAC to serve the External Metrics API.
Example 1: Scaling with Nginx request volume (inline metrics)
Let us start with a common scenario: an application serving HTTP traffic via Nginx, where you want to scale based on request volume rather than CPU. Nginx exposes a status endpoint, the Datadog Agent scrapes it via autodiscovery, and the resulting nginx.net.request_per_s metric flows into Datadog ready for the HPA to consume.
Deploy Nginx with autodiscovery annotations
The Datadog Agent discovers integration configurations from pod annotations. Add the following to your Nginx pod template:
apiVersion: apps/v1
kind: Deployment
metadata:
  name: nginx
  labels:
    app: nginx
spec:
  replicas: 1
  selector:
    matchLabels:
      app: nginx
  template:
    metadata:
      labels:
        app: nginx
      annotations:
        ad.datadoghq.com/nginx.checks: |
          {
            "nginx": {
              "init_config": {},
              "instances": [
                {
                  "nginx_status_url": "http://%%host%%:81/nginx_status/"
                }
              ]
            }
          }
    spec:
      containers:
        - name: nginx
          image: nginx
          ports:
            - containerPort: 81
The %%host%% placeholder is resolved by the Datadog Agent to the pod’s IP at runtime. Once deployed, confirm the metric is flowing by checking the Datadog Metrics Explorer for nginx.net.request_per_s scoped to the relevant tags. It is worth doing this before creating the HPA; a missing or incorrectly tagged metric is the most common source of confusion at this stage, and it is much easier to diagnose in the Metrics Explorer than via kubectl describe hpa.
Define the HPA
Since nginx.net.request_per_s is available directly and does not need transformation, inline mode is the right choice here. You can reference the metric by name and scope it with tag-based label selectors:
apiVersion: autoscaling/v2
kind: HorizontalPodAutoscaler
metadata:
  name: frontend-inline-hpa
spec:
  scaleTargetRef:
    apiVersion: apps/v1
    kind: Deployment
    name: frontend
  minReplicas: 2
  maxReplicas: 10
  metrics:
    - type: External
      external:
        metric:
          name: nginx.net.request_per_s
          selector:
            matchLabels:
              service: frontend
              env: production
        target:
          type: AverageValue
          averageValue: "200"
The AverageValue target type divides the metric value by the current replica count, which is appropriate for a request rate you want to distribute across pods. If your metric represents something that should stay below a fixed threshold regardless of replica count, such as queue depth, use Value instead. The distinction matters: getting it backwards will cause the autoscaler to scale in the wrong direction relative to your intent.
Straightforward enough. The pattern gets more interesting when your metric source is external to the cluster entirely.
Example 2: Scaling with SQS queue depth (DatadogMetric CRD)
A worker service pulling jobs from an AWS SQS queue is one of the cleaner use cases for external metric-based autoscaling. The queue depth is a direct measure of backlog, exactly the kind of leading indicator that makes autoscaling responsive rather than reactive.
Understanding the CloudWatch collection path
Before configuring anything, it is worth tracing how this metric actually reaches the Cluster Agent, because the path is longer than it appears and each step adds latency.
The Datadog AWS integration collects CloudWatch metrics, including SQS metrics like aws.sqs.messages_visible, through a polling mechanism configured at the Datadog account level. This is set up in the Datadog UI under Integrations > AWS, not via the Helm chart. The integration requires an IAM role granting Datadog read access to CloudWatch; Datadog’s documentation provides both a CloudFormation template and a Terraform module for creating that role.
Once the integration is active, Datadog polls CloudWatch every 10 minutes by default. CloudWatch itself can add a further 5 to 10 minutes of propagation delay before new metric values are available. Stack those delays together and you have a realistic end-to-end latency of 15 to 20 minutes between a change in queue depth and the Cluster Agent seeing a stable value.
So under the hood, when you configure a rollup window for a CloudWatch-sourced metric, you are not just smoothing noise; you are also compensating for a metric source that is structurally delayed. A .rollup(avg, 60) applied to aws.sqs.messages_visible ensures the Cluster Agent is querying against a stable, fully-propagated window rather than a partially-ingested one. This is why we always recommend an explicit rollup for CloudWatch metrics, even when the underlying metric looks clean in the Datadog Metrics Explorer.
With that latency in mind, verify the metric is flowing before proceeding:
kubectl get --raw "/apis/external.metrics.k8s.io/v1beta1" | jq '.resources[] | .name' 2>/dev/null
If it is not yet visible via the External Metrics API, confirm the Cluster Agent is healthy and the metric has data in Datadog. An SQS metric that shows data in the Metrics Explorer but does not appear here typically points to a tag mismatch between the Datadog query and the label selector in the HPA.
Define the DatadogMetric CRD
For this example, we will use CRD mode rather than inline. Queue depth metrics benefit from explicit rollup configuration, and the DatadogMetric CRD lets you express that clearly:
apiVersion: datadoghq.com/v1alpha1
kind: DatadogMetric
metadata:
  name: video-sqs-depth
  namespace: video
spec:
  query: "avg:aws.sqs.messages_visible{queuename:video-processing,env:prod}.rollup(avg, 60)"
The .rollup(avg, 60) is deliberate for the reasons explained above. Without it, the Cluster Agent may query against a metric window that straddles two CloudWatch collection cycles, producing a reading that is partially stale. Aligning the rollup window to the collection interval gives you a stable value to act on.
Reference the metric in your HPA
When referencing a DatadogMetric from an HPA, the metric name must use the datadogmetric@<namespace>:<name> format. The bare name alone is only valid in inline mode:
apiVersion: autoscaling/v2
kind: HorizontalPodAutoscaler
metadata:
  name: transcoder-crd-hpa
  namespace: video
spec:
  scaleTargetRef:
    apiVersion: apps/v1
    kind: Deployment
    name: transcoder
  minReplicas: 1
  maxReplicas: 20
  metrics:
    - type: External
      external:
        metric:
          name: datadogmetric@video:video-sqs-depth
        target:
          type: Value
          value: "50"
Here, a target value of 50 means the autoscaler will aim to keep the queue below 50 visible messages, scaling replicas up or down accordingly. Tune this threshold based on your worker throughput: if each worker processes around 5 messages per minute, size the replica count so the queue drains in a reasonable window given the expected burst size. There is no universal right answer; the target value is a function of your workload’s throughput characteristics and your tolerance for queue backlog.
Keep the CloudWatch latency in mind when evaluating whether scaling is responsive enough. With 15 to 20 minutes of metric delay, your autoscaler will not react to queue growth the instant it happens. That is usually acceptable for background processing workloads, where the queue absorbs the burst, but it is worth factoring into your stabilisation window settings, which we address in the tuning section below.
Example 3: Combining metrics for more robust scaling
Kubernetes HPAs scale to the most demanding metric when you define multiple signals. This is a useful property: you get sensible default behaviour without extra logic, and different metric types can cover different failure modes.
A pattern we have used across several environments is combining request rate, a leading indicator of current load, with queue depth, a signal of accumulating backlog. Either can independently trigger scaling, so the deployment responds to whichever pressure is building first:
apiVersion: autoscaling/v2
kind: HorizontalPodAutoscaler
metadata:
  name: transcoder-crd-hpa
  namespace: video
spec:
  scaleTargetRef:
    apiVersion: apps/v1
    kind: Deployment
    name: transcoder
  minReplicas: 1
  maxReplicas: 20
  metrics:
    - type: External
      external:
        metric:
          name: nginx.net.request_per_s
          selector:
            matchLabels:
              service: transcoder
              env: production
        target:
          type: AverageValue
          averageValue: "250"
    - type: External
      external:
        metric:
          name: datadogmetric@video:video-sqs-depth
        target:
          type: Value
          value: "100"
Adding CPU as a fallback
You can also mix in a resource metric. This gives you a reactive local signal alongside your external signals, which is useful if the external metric source becomes delayed or temporarily unavailable:
    - type: Resource
      resource:
        name: cpu
        target:
          type: Utilization
          averageUtilization: 70
Having CPU as a third signal means your autoscaler will not stall entirely if the Cluster Agent temporarily loses contact with Datadog’s API. It is a straightforward resilience measure that is often worth including, particularly for services where the cost of under-provisioning is high. The local CPU signal is always available regardless of what is happening with external connectivity, and it degrades gracefully: even if it is not the ideal scaling signal for your workload, it is better than no signal at all.
Tuning Your Autoscaler’s Behaviour
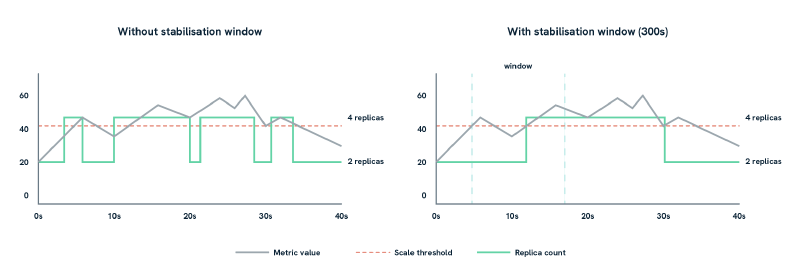
The behavior field deserves attention, particularly when using external metrics that fluctuate or arrive with some delay. The graphic above illustrates why it matters: Without it, your autoscaler can flap, scaling up and down rapidly as a noisy metric crosses the threshold. The same noisy metric produces eight scale events without a stabilisation window, and two with one:
  behavior:
    scaleUp:
      stabilizationWindowSeconds: 30
      policies:
        - type: Percent
          value: 50
          periodSeconds: 60
    scaleDown:
      stabilizationWindowSeconds: 300
The scaleDown.stabilizationWindowSeconds of 300 seconds (five minutes) is the most important setting here. It prevents the autoscaler from immediately scaling down after a spike, which would cause churn if traffic picks back up shortly after. Scale-up intentionally has a shorter window; you generally want to respond to load faster than you shed capacity.
For CloudWatch-sourced metrics specifically, the structural delay described earlier means the autoscaler is always working with data that is already significantly stale, in the order of 15 to 20 minutes. We have found it useful to increase the scale-up stabilisation window for these metrics, to 300 seconds or more, to avoid responding to what turns out to be transient noise in the aggregated data. The tradeoff is a slightly slower reaction to genuine load increases; in practice, for background processing workloads where the queue absorbs burst traffic, this is usually the right balance. For latency-sensitive services, you may want to stay with a shorter window and accept the occasional unnecessary scale event.
Verifying it works
A few commands worth running once everything is wired up:
# View scaling decisions and current metric values seen by the HPA
kubectl describe hpa transcoder-crd-hpa -n video

# List all metrics currently available via the External Metrics API
kubectl get --raw "/apis/external.metrics.k8s.io/v1beta1" | jq

# Inspect the current value of a specific DatadogMetric resource
kubectl get datadogmetric video-sqs-depth -n video -o yaml
The kubectl describe hpa output is the most useful first stop when something is not behaving as expected. The Events section shows whether the HPA is successfully retrieving metric values, and the Current Metrics block shows what value the autoscaler last acted on. We have found this invaluable for diagnosing cases where the autoscaler is technically functioning but scaling at unexpected times: the events tell you exactly what the scaler was seeing at the moment it made each decision.
Datadog’s Metrics Explorer is also useful here. Confirm that the metric values you are seeing in Kubernetes match what Datadog is reporting, with the expected tags and at the expected frequency. A mismatch between the two often points to a caching issue on the Cluster Agent side; a restart usually resolves it.
If things are not working:
- Double-check metric names and tag values. A tag mismatch is the most common cause of a metric not being found, and the error message from the HPA (
failed to get external metric) is not always specific about which tag is wrong. - Confirm the Cluster Agent has the correct RBAC permissions and is healthy.
- Check whether the metric is arriving in Datadog before assuming a Kubernetes-side problem. If it is not in the Metrics Explorer, no amount of HPA configuration will fix it.
A Note on cardinality and cost
High-cardinality tags in your metric queries, things like user_id, customer_name, or pod_id, can slow down Cluster Agent queries and significantly increase your Datadog usage costs. Stick to stable, coarse-grained tags: env, queue_name, service, team. These give you the filtering granularity you need for autoscaling without the overhead.
It is also worth noting that each unique metric query the Cluster Agent runs counts against your Datadog API rate limits. In clusters with many HPAs and DatadogMetric resources, this can add up. CRD mode gives you more visibility into exactly which queries are running, because each DatadogMetric resource is explicit and auditable, which makes it easier to identify redundant or overlapping queries. If you are running more than a handful of autoscaled workloads, this auditability is one of the stronger practical arguments for CRD mode over inline.
When not to use external metrics
External metrics work well for workloads where the demand signal is more meaningful than local resource utilisation. They are less appropriate in a few situations worth being explicit about:
- If you need sub-30-second scaling reactions, external metrics introduce inherent delay. Local CPU or memory will always be more responsive, though as we have discussed, CPU is a lagging indicator for many application workloads.
- If the external system can go offline or lag significantly, your autoscaler loses its primary signal. CPU as a fallback metric helps, but it will not cover all cases.
- If the metric fluctuates rapidly, with high-frequency noise rather than a sustained trend, the autoscaler can churn. Rollup functions in your
DatadogMetricquery can smooth this out, but it requires careful tuning and an understanding of your metric’s natural variance.
For workloads where any of these concerns apply, combining external metrics with a resource metric fallback, or leaning on the behavior field to dampen reactions, is usually the right approach. The two are not mutually exclusive.
Final thoughts
External metrics let you align your autoscaling with signals that reflect what your workload is doing, rather than what the node happens to be consuming at that moment. The pattern is straightforward once the Cluster Agent is configured: define your metric, reference it from an HPA, tune the behaviour, and the fundamentals are in place.
Start with inline mode if your metrics are simple and you are moving quickly. Move to DatadogMetric CRDs as your needs mature; the reusability and auditability are worth it in any environment that more than one team touches, and the explicit rollup configuration they support is particularly valuable for CloudWatch-sourced metrics. Always have some visibility into what your autoscaler is seeing: the debugging commands above, combined with a Datadog dashboard tracking HPA decisions alongside the underlying metric values, make a significant difference when something behaves unexpectedly at an inconvenient hour.
If you would prefer a different model for custom-metric autoscaling, Datadog Kubernetes Autoscaling (DKA) is worth evaluating. Rather than managing HPAs and DatadogMetric CRDs as separate resources, DKA consolidates everything into a single DatadogPodAutoscaler CRD, covering CPU / memory scaling, custom Datadog metric queries, and vertical resizing from one resource definition per workload. For teams already invested in the HPA approach, what we have outlined here remains a solid, production-ready foundation; but if you are starting fresh or want a more unified resource model, Post 3 in this series covers the DatadogPodAutoscaler in detail.
This blog is part of our Kubernetes Autoscaling with Datadog series, we recommend reading the rest of the posts in the series: