
Kubernetes Autoscaling: Getting Started with Datadog
Learn how to scale Kubernetes workloads based on custom Datadog metrics using the Datadog Cluster Agent and Horizontal Pod Autoscaler
Written by:
Published on:
Last updated on:
This blog is part of our Kubernetes Autoscaling with Datadog series, we recommend reading the rest of the posts in the series:
Horizontal Pod Autoscalers are essential for building scalable, cost-effective Kubernetes workloads. They automatically adjust the number of pod replicas based on observed metrics, helping applications stay responsive whilst keeping cloud costs in check. CPU and memory are the defaults, but modern applications often demand something more granular. Think HTTP request rates, job queue sizes, or business-level signals that do not map neatly onto infrastructure utilisation.
If your team is already using Datadog for monitoring, those application-level metrics can be turned into autoscaling signals. This post walks through how to configure the Datadog Cluster Agent to serve external metrics to Kubernetes, enabling HPAs to scale based on metrics that reflect what a workload is actually doing.
What This Series Covers
This series will cover three approaches to autoscaling Kubernetes workloads using Datadog metrics, and how to decide between them:
- HPA + Datadog Cluster Agent: Kubernetes’ native Horizontal Pod Autoscaler consuming metrics surfaced by the Cluster Agent as an External Metrics Provider. No additional operators required, explicit and auditable configuration, and compatible with any environment that can reach the standard Datadog API endpoints.
- DatadogPodAutoscaler: Datadog’s first-party autoscaling resource, which consolidates horizontal and vertical scaling into a single CRD. It supports CPU / memory scaling, custom query scaling against arbitrary Datadog metric queries, and cost observability through Cloud Cost Management; all from a single resource definition per workload. It requires outbound connectivity to Datadog’s Remote Configuration service, which is a hard architectural dependency rather than a configuration detail, and one that will rule it out in some environments.
- KEDA: A CNCF project with a native Datadog scaler that supports scale-to-zero and multi-source trigger composition. Well suited to workloads that need to reach zero replicas during idle periods, or teams already running KEDA for other scalers.
This is the first post in the five-part series. Here is where each post fits:
- Post 1 (this post): Installing and configuring the Datadog Cluster Agent as an External Metrics Provider, in both inline and CRD modes, with a complete test application to verify the setup.
- Post 2: Building HPAs against real Datadog metrics, including Nginx request rate, SQS queue depth, and combining multiple signals in a single autoscaler.
- Post 3: Configuring the
DatadogPodAutoscalerCRD, Datadog’s own autoscaling resource, for horizontal, vertical, multidimensional, and custom-query scaling. - Post 4: The architectural trade-offs between the HPA + Cluster Agent approach and KEDA, including working configurations for both.
- Post 5: A workload archetype guide to help teams decide which tool fits which situation.
If they already have the Cluster Agent running with the external metrics provider enabled and want to move straight to practical HPA examples, Post 2 is the right starting point. If they are evaluating which approach fits their environment, Post 5 covers that decision across concrete workload archetypes.
This post focuses on the HPA + Cluster Agent path, which remains fully supported and is the right default for teams with existing HPA investments, GitOps workflows that own their scaling configuration, or requirements for fine-grained control over autoscaler behaviour. With that context established, here is what it takes to get the setup running.
How Datadog Uses the External Metrics API
Kubernetes supports two APIs for enabling autoscaling beyond resource metrics:
- Custom Metrics API (
custom.metrics.k8s.io): Used for metrics tied directly to Kubernetes objects, such asPodorDeploymentresources. - External Metrics API (
external.metrics.k8s.io): Used for metrics not bound to a specific Kubernetes object.
Datadog uses the External Metrics API exclusively. This matters for how HPAs are structured:
- Scaling based on pod-specific metrics (such as requests per pod) is not possible through this path.
- Metrics must be global or filtered using Datadog tags.
- HPAs reference metrics by name and label selectors, which map to Datadog tags.
Common use cases include HTTP request rate across a Deployment, queue depth from background workers, custom business KPIs, and third-party signals already flowing into Datadog.
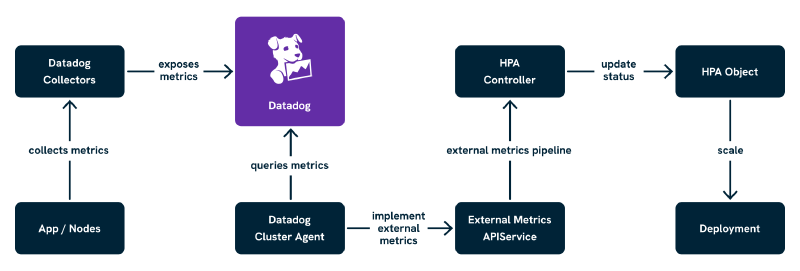
As shown above, the Datadog Cluster Agent queries Datadog for metrics exposed by applications and surfaces them through the Kubernetes External Metrics API. The HPA then consumes those values and adjusts workload replica counts accordingly. With that architecture in mind, let us look at what it takes to get this running.
Prerequisites
Before proceeding, confirm the following are in place:
- Kubernetes v1.26 or later.
helmv3.x installed and configured to target the cluster.- A Datadog account with an API key and an app key. The app key is required specifically for the External Metrics Provider to query the Datadog API.
kubectlaccess to the cluster with sufficient permissions to create namespaces,Secretresources, and deploy Helm releases.
The setup here does not require any specific node configuration, but the Cluster Agent will need outbound access to Datadog’s API endpoints (api.datadoghq.eu for EU-region accounts, api.datadoghq.com for US-region). In environments with strict egress controls, confirm this before proceeding, or the metrics provider will install successfully but silently fail to retrieve any metrics.
Helm Setup of the Datadog Cluster Agent
The Datadog Cluster Agent provides the external metrics adapter functionality out of the box, deployed alongside the standard node agents using Datadog’s official Helm chart. It supports two modes of operation:
- Inline metric queries: The HPA defines the metric name and tag selectors directly. Simpler to get started, and a reasonable default for most teams.
DatadogMetricCRD resources: Metric queries are defined separately as Kubernetes resources and referenced by name from the HPA. Better suited to teams who want auditable, reusable definitions or GitOps-friendly configuration.
We will walk through both.
Add the Datadog Helm Repository
helm repo add datadog https://helm.datadoghq.com
helm repo update
Create a Dedicated Namespace
kubectl create namespace datadog
Then create the Secret containing the Datadog API key and app key:
kubectl create secret generic datadog-secret \
  -n datadog \
  --from-literal api-key=<DATADOG_API_KEY> \
  --from-literal app-key=<DATADOG_APP_KEY>
Mode A: Inline Metric Queries (Default Mode)
In this mode, HPAs define external metrics directly using a metric name and a set of tag-based label selectors. The Cluster Agent translates those into Datadog queries on the fly. It is the fastest path to a working setup.
datadog:
  apiKeyExistingSecret: datadog-secret
  appKeyExistingSecret: datadog-secret
  # Use datadoghq.com if based in the US region
  site: datadoghq.eu

clusterAgent:
  enabled: true
  metricsProvider:
    enabled: true
    # useDatadogMetrics: false keeps inline mode active (this is the default)
    useDatadogMetrics: false

agents:
  enabled: true

rbac:
  create: true

serviceAccounts:
  clusterAgent:
    create: true
    name: datadog-cluster-agent
Install with:
helm install datadog-agent datadog/datadog \
  --namespace datadog \
  --values values.yaml
This sets up the Datadog Agent DaemonSet (for log, trace, and metric collection), the Cluster Agent (to serve the external metrics API), RBAC and API registration for external.metrics.k8s.io, and dynamic metric query support for HPAs.
Mode B: DatadogMetric CRDs (Declarative Mode)
For more control, reusability, and GitOps compatibility, enable the CRD-based approach. In this mode, DatadogMetric resources are defined ahead of time, and HPAs reference those by name.
The values.yaml for this mode differs only in the useDatadogMetrics flag:
datadog:
  apiKeyExistingSecret: datadog-secret
  appKeyExistingSecret: datadog-secret
  site: datadoghq.eu

clusterAgent:
  enabled: true
  metricsProvider:
    enabled: true
    # Setting useDatadogMetrics to true enables DatadogMetric CRD mode
    useDatadogMetrics: true

agents:
  enabled: true

rbac:
  create: true

serviceAccounts:
  clusterAgent:
    create: true
    name: datadog-cluster-agent
Install with the same helm install command as above. Once deployed, DatadogMetric resources are defined manually for each metric to scale on. This is well-suited to teams managing their scaling configuration separately from application manifests, shared clusters with strict governance, or central platform teams publishing reusable metric definitions.
One useful detail: if CRD mode is enabled but HPAs still use the inline format, the Cluster Agent will automatically create DatadogMetric resources (prefixed dcaautogen-) to handle them, giving a smooth migration path. These are cleaned up automatically once the relevant HPAs are migrated.
Verifying the APIService Registration
Regardless of which mode is in use, confirm that the External Metrics API is registered and available:
kubectl get apiservice v1beta1.external.metrics.k8s.io
You should see output similar to this:
NAME                              SERVICE                         AVAILABLE   AGE
v1beta1.external.metrics.k8s.io  datadog/datadog-cluster-agent   True        2m
If AVAILABLE shows False, this is most commonly a TLS or trust issue between the API server and the Cluster Agent service. Inspect it with:
kubectl describe apiservice v1beta1.external.metrics.k8s.io
And check the Cluster Agent logs for context:
kubectl logs -n datadog deploy/datadog-cluster-agent
A common message here is something like x509: certificate signed by unknown authority, which indicates the API server cannot verify the Cluster Agent’s serving certificate. Restarting the Cluster Agent after the Helm install often resolves this, as the certificate registration can occasionally race with pod readiness. If the problem persists, the clusterAgent.metricsProvider.createReaderRbac and clusterAgent.metricsProvider.wpaController settings in the Helm chart are worth reviewing against the Datadog Agent Helm chart documentation.
With the API service confirmed as available, the setup is ready to test end to end.
Testing the Setup
The clearest way to verify the full pipeline is to deploy an application that emits a custom metric, then wire up an HPA to scale it based on that signal. We will use a simple Flask application that sends a counter metric via DogStatsD.
How DogStatsD Metric Collection Works
In Kubernetes, the Datadog Agent runs as a DaemonSet on each node. Pods send metrics to it via UDP using the host’s IP address, which is available to pods through the downward API as status.hostIP. The Datadog Agent then forwards those metrics to the Datadog backend, tagged with the Kubernetes metadata it collects automatically (namespace, pod name, deployment name, and so on). The Cluster Agent subsequently queries those metrics and surfaces them through the External Metrics API for the HPA to consume.
The chain is: application pod → DogStatsD on the node agent → Datadog backend → Cluster Agent External Metrics API → HPA.
The Test Application
Here is the Flask application code. It increments a counter metric on every request, tagged with the namespace and deployment name so the HPA can filter on those later:
import os
from datadog import initialize, statsd
from flask import Flask

app = Flask(__name__)

options = {
    "statsd_host": os.environ.get("DD_AGENT_HOST", "localhost"),
    "statsd_port": 8125,
}
initialize(**options)

@app.route("/")
def index():
    statsd.increment(
        "flask.request.rate",
        tags=["kube_namespace:test", "kube_deployment:test-metric-app"]
    )
    return "Hello!"

if __name__ == "__main__":
    app.run(host="0.0.0.0", port=5000)
Build and push this to a container registry accessible to the cluster, then deploy the following manifests into a namespace called test:
kubectl create namespace test
The Deployment manifest for the test application:
apiVersion: apps/v1
kind: Deployment
metadata:
  name: test-metric-app
  namespace: test
  labels:
    app: test-metric-app
spec:
  replicas: 1
  selector:
    matchLabels:
      app: test-metric-app
  template:
    metadata:
      labels:
        app: test-metric-app
    spec:
      containers:
        - name: test-metric-app
          image: <YOUR_REGISTRY>/test-metric-app:latest
          ports:
            - containerPort: 5000
          env:
            - name: DD_AGENT_HOST
              valueFrom:
                fieldRef:
                  fieldPath: status.hostIP
          resources:
            requests:
              cpu: 100m
              memory: 128Mi
            limits:
              cpu: 200m
              memory: 256Mi
And the Service to expose it within the cluster:
apiVersion: v1
kind: Service
metadata:
  name: test-metric-app
  namespace: test
spec:
  selector:
    app: test-metric-app
  ports:
    - port: 80
      targetPort: 5000
The DD_AGENT_HOST environment variable, populated from status.hostIP via the downward API, is what points the DogStatsD client at the correct node agent. Without it, the client defaults to localhost, which will not resolve correctly inside a Kubernetes pod.
Confirm the Metric Is Arriving in Datadog
Before creating the HPA, verify that flask.request.rate is visible in the Datadog Metrics Explorer with the tags kube_namespace:test and kube_deployment:test-metric-app. Port-forward the service and generate a few requests:
kubectl port-forward svc/test-metric-app -n test 8080:80
curl http://localhost:8080/
Allow a minute or two for the metric to appear in Datadog (the agent collects and flushes every 10 seconds by default, and Datadog’s ingestion pipeline adds a small delay). If the metric does not appear, check the node agent logs on the same node as the test pod:
kubectl logs -n datadog -l app=datadog-agent --field-selector spec.nodeName=<NODE_NAME>
Look for DogStatsD receive confirmations or errors. A metric that never reaches Datadog cannot be surfaced by the Cluster Agent, regardless of how the HPA is configured, so it is worth being certain at this stage.
Creating an HPA Using the External Metric
With the metric flowing into Datadog and the API service confirmed as available, the HPA can now be created.
Option A: Inline Metric Query
In the default mode (useDatadogMetrics: false), define the metric directly in the HPA using name and tag selectors:
apiVersion: autoscaling/v2
kind: HorizontalPodAutoscaler
metadata:
  name: test-metric-hpa
  namespace: test
spec:
  scaleTargetRef:
    apiVersion: apps/v1
    kind: Deployment
    name: test-metric-app
  minReplicas: 1
  maxReplicas: 5
  metrics:
  - type: External
    external:
      metric:
        name: flask.request.rate
        selector:
          matchLabels:
            kube_namespace: test
            kube_deployment: test-metric-app
      target:
        type: Value
        value: "5"
Option B: DatadogMetric CRD
In CRD mode (useDatadogMetrics: true), define the metric first as a DatadogMetric resource:
apiVersion: datadoghq.com/v1alpha1
kind: DatadogMetric
metadata:
  name: flask-request-rate
  namespace: test
spec:
  query: 'avg:flask.request.rate{kube_namespace:test,kube_deployment:test-metric-app}'
Then reference it from the HPA using the datadogmetric@<namespace>:<name> format:
apiVersion: autoscaling/v2
kind: HorizontalPodAutoscaler
metadata:
  name: test-metric-hpa
  namespace: test
spec:
  scaleTargetRef:
    apiVersion: apps/v1
    kind: Deployment
    name: test-metric-app
  minReplicas: 1
  maxReplicas: 5
  metrics:
  - type: External
    external:
      metric:
        name: datadogmetric@test:flask-request-rate
      target:
        type: Value
        value: "5"
The DatadogMetric can be created in the same namespace as the application or centrally in a shared one, provided the HPA references the correct namespace in the metric name.
Simulate Load and Observe Scaling
Generate sustained traffic against the test application:
hey -z 30s -c 10 http://localhost:8080/
Watch the HPA and Deployment in parallel:
kubectl get hpa -n test -w
kubectl get deploy -n test -w
If everything is working, the replica count will increase as the metric exceeds the target threshold of 5 requests. The HPA evaluates every 15 seconds by default, and the Cluster Agent polls Datadog every 30 seconds, so allow 30 to 60 seconds after traffic begins before expecting a scale event.
In CRD mode, the current metric value can be inspected directly on the DatadogMetric resource:
kubectl get datadogmetric flask-request-rate -n test -o yaml
Look at the status.currentValue field. If it is not updating, or is consistently 0 when traffic is flowing, that points to an issue with the Cluster Agent’s connection to Datadog rather than with the HPA configuration.
What to Check if Scaling Does Not Happen
The fastest diagnostic path is:
kubectl describe hpa test-metric-hpa -n test
The Events section will show whether the HPA is successfully retrieving metric values or encountering errors. Common messages and their meanings:
failed to get external metric flask.request.rate: the Cluster Agent cannot find this metric; check the tag selectors match what Datadog is reporting.invalid metrics (1 invalid out of 1), first error: failed to get external metric: the External Metrics API is not responding; check the API service status.DesiredReplicas: 1, CurrentReplicas: 1: the HPA is evaluating successfully but the metric is below the target threshold; confirm traffic is generating the expected metric volume in the Datadog Metrics Explorer.
Production Considerations
Prefer DatadogMetric CRDs for Shared, Auditable Metrics
Inline queries are quick to start with, but CRD mode offers meaningful operational advantages over time: auditable, reusable metric definitions; cleaner GitOps compatibility; and a separation of concerns where metrics are managed independently of HPA configuration. On any cluster serving multiple teams, environments where HPAs change frequently, or setups where a central platform team wants to publish approved metric definitions for application teams to consume, CRD mode is the better default.
Tune the Polling Frequency
The Cluster Agent polls Datadog every 30 seconds by default. For faster scaling reactions, this can be reduced by configuring DD_EXTERNAL_METRICS_PROVIDER_POLLING_INTERVAL via the Helm chart’s clusterAgent.env block:
clusterAgent:
  env:
    - name: DD_EXTERNAL_METRICS_PROVIDER_POLLING_INTERVAL
      value: "15"
Shorter intervals mean faster autoscaling responses, but also higher load on Datadog’s API and the Cluster Agent itself. 15 seconds is a reasonable lower bound for most workloads; going below that is unlikely to produce meaningful improvement and will increase API usage cost noticeably.
RBAC and Namespacing for DatadogMetric Resources
Create DatadogMetric resources scoped to the relevant namespace:
metadata:
  name: flask-request-rate
  namespace: team-a
Use RBAC to restrict who can create or modify metric definitions in each namespace. This prevents teams from inadvertently scaling on each other’s signals, which is a subtle failure mode that is frustrating to diagnose.
Label Discipline
Consistent labelling is critical, whether using tag selectors in inline mode or filtering queries in CRD mode. Standardising on labels like team, service, kube_namespace, and kube_deployment across all workloads improves both filterability and observability, and avoids the kind of accidental metric overlap that is genuinely difficult to debug under pressure.
Monitoring Autoscaling Decisions
It is worth setting up visibility into what the autoscaler is actually doing before this reaches production. At minimum, a Datadog dashboard that plots the metric values alongside replica count changes makes it straightforward to correlate scaling decisions with underlying signals. For DatadogMetric CRDs, a monitor on stale currentValue (a value that has not updated in over 60 seconds whilst traffic is flowing) gives early warning of Cluster Agent connectivity problems. Autoscaling issues are considerably easier to diagnose when there is a clear view of what the scaler was seeing at the moment it made a decision.
Multi-Tenancy Considerations
Namespaced DatadogMetric Resources
Declaring metrics per team or namespace and restricting access via RBAC prevents teams from reading each other’s metric definitions or accidentally scaling based on the wrong signals:
apiVersion: datadoghq.com/v1alpha1
kind: DatadogMetric
metadata:
  name: flask-request-rate
  namespace: checkout
spec:
  query: 'avg:flask.request.rate{team:checkout}'
Cross-Team Tag Overlap
Without scoped tags, a tag-filtered query is effectively global. Each team should use well-defined tags that prevent ambiguity, team:checkout is considerably more reliable than env:prod alone when multiple services share the same environment label.
Centralised Monitoring of Autoscaling Decisions
Datadog dashboards can track HPA decisions and metric trends, alert on stale DatadogMetric values, and surface over-aggressive scaling from noisy signals. Building this visibility early pays dividends; a scaling event that behaves unexpectedly at 02:00 is much easier to investigate when the relevant metric history is already captured in a dashboard.
Debugging Common Issues
Metric Not Found
Check which metrics are currently exposed to the External Metrics API:
kubectl get --raw "/apis/external.metrics.k8s.io/v1beta1"
Then inspect the Cluster Agent logs:
kubectl logs -n datadog deploy/datadog-cluster-agent
Confirm the metric is being reported to Datadog with the expected tags. The Datadog Metrics Explorer is the fastest way to verify this; if the metric does not appear there, the problem is upstream of Kubernetes entirely.
DatadogMetric Status Not Updating
kubectl describe datadogmetric flask-request-rate -n test
Look for errors indicating invalid query syntax, permission issues with the Cluster Agent not being able to read custom resources, or Datadog API rate limits. The Cluster Agent logs will usually contain more context alongside:
kubectl logs -n datadog deploy/datadog-cluster-agent
HPA Doesn’t Scale
Confirm the metric value is exceeding the target, then check what the HPA has seen:
kubectl describe hpa test-metric-hpa -n test
The Last Scale Time and Current Metrics fields are usually the fastest way to understand what is happening. Confirm that the metric tags in the HPA selector match what Datadog is reporting; even a minor mismatch (such as kube_deployment vs deployment) will cause the metric lookup to return nothing.
APIService Not Available
kubectl get apiservice v1beta1.external.metrics.k8s.io
If the status is False, TLS trust is the most common cause. Restarting the Cluster Agent after updating certificates usually resolves it:
kubectl rollout restart deploy/datadog-cluster-agent -n datadog
Wrapping Up
Getting the Datadog Cluster Agent running as an External Metrics Provider is the foundation for everything else in this series. The two modes, inline for simplicity and CRD-based for reusability, give enough flexibility to start quickly and evolve the configuration as requirements mature. The test application walkthrough here is intentionally minimal; its purpose is to confirm the full pipeline is working before adding the complexity of real application metrics.
In this post, we covered:
- How the External Metrics API fits into Kubernetes autoscaling, and why Datadog uses it rather than the Custom Metrics API.
- Installing and configuring the Datadog Cluster Agent via Helm in both inline and CRD modes.
- Deploying a complete test application with
DeploymentandServicemanifests, and verifying metric flow end to end. - Production considerations including polling frequency, RBAC, label discipline, and monitoring autoscaling decisions.
- Debugging the most common failure modes at each layer of the pipeline.
In the next post, we move from setup into practice, working through real-world HPA configurations for Nginx request rate and SQS queue depth, and covering how to combine multiple signals in a single autoscaler.
This blog is part of our Kubernetes Autoscaling with Datadog series, we recommend reading the rest of the posts in the series: