
How to use Custom & External Metrics for Kubernetes HPA
An introduction to scaling Kubernetes workloads with application-aware metrics using Metrics Adapters and Horizontal Pod Autoscaling
Written by:
Published on:
Last updated on:
This blog is part of our Horizontal Pod Autoscaling series, we recommend reading the rest of the posts in the series:
- Introduction to Horizontal Pod Autoscaling in Kubernetes
- How to use Custom & External Metrics for Kubernetes HPA
- Set up Kubernetes scaling via Prometheus & Custom Metrics
- Leveraging Kubernetes HPA and Prometheus Adapter
Scaling Kubernetes Workloads with Custom and External Metrics
If you’re running applications in Kubernetes and want to make them more responsive to real world usage patterns, Horizontal Pod Autoscaling (HPA) is an essential tool. By default, HPA adjusts the number of running pods based on CPU and memory usage. But what if you want to scale based on something more meaningful to your application, such as request rates or the depth of a work queue?
That’s where custom and external metrics come in. This post will guide you through the concepts and components involved in enabling advanced autoscaling using Kubernetes metrics APIs. Whether you’re just getting started or looking to go beyond the basics, this guide is for you.
Metrics Adapters: Bridging Kubernetes and Your Monitoring System
A metrics adapter connects your monitoring system to Kubernetes, allowing metrics to be surfaced through the Kubernetes metrics APIs. These adapters enable HPA to access a wider range of metrics beyond CPU and memory.
Kubernetes supports various adapters depending on the monitoring backend you use. Some examples include Prometheus Adapter, Datadog Cluster Agent, and GCP Stackdriver Adapter.
Regardless of the provider, all adapters perform the same role: they expose metrics in a format compatible with the Kubernetes metrics APIs.
Prometheus is commonly used due to its Kubernetes-native integration and broad ecosystem. We’ll explore it in more depth in the next post of this series.
Custom Metrics API and External Metrics API Overview
Before diving into setup, it helps to understand the distinction between the two most important metrics APIs that go beyond CPU and memory: the Custom Metrics API and the External Metrics API.
- Custom Metrics API (
custom.metrics.k8s.io): This API is for metrics tied to Kubernetes objects, such as pods or nodes. These metrics are often generated by your application and exposed internally. The key point here is that the metrics are associated with specific Kubernetes resources. This allows HPA to calculate averages per pod or node and scale accordingly. - External Metrics API (
external.metrics.k8s.io): This API is for metrics that are not tied to a Kubernetes object and may originate outside the cluster. These metrics are generally used when the value being measured influences the application’s desired scale but isn’t something a specific pod is directly responsible for, like the number of messages in a remote queue.
In short:
- Use Custom Metrics API when your metric is tied to a Kubernetes object (such as HTTP requests per pod).
- Use External Metrics API when your metric originates outside the cluster or isn’t tied to a specific object (such as messages in an external queue).
Both APIs require a metrics adapter to translate and expose external metric data in a format that the Kubernetes HPA can understand.
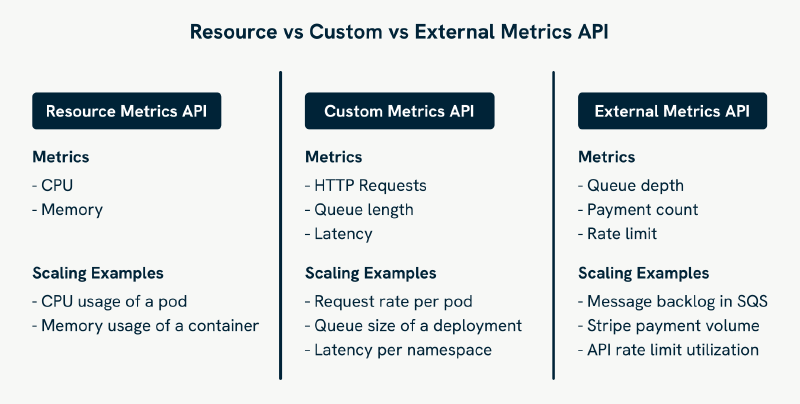
Kubernetes supports three main metrics APIs that the HPA can use:
- Resource Metrics API (
metrics.k8s.io): This is the default for HPA, used for scaling based on CPU and memory. It collects metrics via a component like Metrics Server. - Custom Metrics API (
custom.metrics.k8s.io): Use this when you want to scale based on metrics related to Kubernetes objects, like pods or nodes, or metrics exposed by your application. For instance, you could scale based on the number of HTTP requests per second. To use this API, you’ll need a metrics adapter, such as the Prometheus Adapter, that connects Kubernetes to Prometheus and translates queries accordingly. - External Metrics API (
external.metrics.k8s.io): This is for metrics that originate outside the Kubernetes cluster, like data from a third-party service or external Prometheus instance. The same Prometheus Adapter can serve this API as well.
Understanding Metric Types in HPA
When you’re configuring a Horizontal Pod Autoscaler (HPA), the metrics section defines how scaling decisions are made. Kubernetes supports several types of metrics, and the right one depends on what you’re measuring and where that data comes from.
Here’s how to think about it:
type: Resourceis the most common and the default. It uses built-in metrics like CPU and memory usage, pulled from themetrics.k8s.ioAPI via the Metrics Server. Use this when you just want to scale based on pod resource usage.type: ContainerResourceis similar toResource, but lets you scale based on resource usage within a specific container in each pod. This is useful when only one container in a multi-container pod matters for scaling.type: Podsis used with thecustom.metrics.k8s.ioAPI. It lets you scale based on application-level metrics that are collected per pod, like how many HTTP requests each pod is handling per second.type: Objectis also part of thecustom.metrics.k8s.ioAPI. It’s used when your metric describes a specific Kubernetes object (for example, the average response latency of a Service).type: Externalis only used with theexternal.metrics.k8s.ioAPI. It covers metrics that aren’t tied to any Kubernetes object, like queue depth in a third-party system or rate limits from an external API.
How Kubernetes Integrates Metrics APIs
To support custom and external metrics, Kubernetes uses an API aggregation layer. This lets Kubernetes expose additional API endpoints by forwarding requests to a separate component, in this case, the metrics adapter.
You can check which metrics APIs are active by listing Kubernetes APIService resources. For example:
kubectl get apiservice v1beta1.metrics.k8s.io -o yaml
An example output might look like this:
apiVersion: apiregistration.k8s.io/v1
kind: APIService
metadata:
  name: v1beta1.metrics.k8s.io
spec:
  group: metrics.k8s.io
  version: v1beta1
  service:
    name: metrics-server
    namespace: kube-system
  insecureSkipTLSVerify: true
  groupPriorityMinimum: 100
  versionPriority: 100
This tells the Kubernetes API server to forward requests to the metrics-server service. You’ll do something similar for the Prometheus Adapter when custom.metrics.k8s.io and external.metrics.k8s.io is enabled.
Once everything is in place, Kubernetes can query Prometheus through the adapter and use those metrics to make autoscaling decisions.
Autoscaling Architecture
Now that we’ve covered the metrics APIs themselves, let’s look at how the general architecture for metrics-driven autoscaling works. While this example references Prometheus, similar setups are possible with other monitoring systems such as Datadog or GCP Stackdriver using their respective adapters.
Here’s how the components work together to enable autoscaling with custom and external metrics:
- Monitoring System (such as Prometheus, Datadog): Collects and stores metrics exposed by your application and infrastructure.
- Metrics Adapter: Translates queries from the HPA into the query language of the monitoring system (such as PromQL for Prometheus, Datadog query language), and formats the results for the Kubernetes metrics APIs.
- Horizontal Pod Autoscaler: Consumes metrics from the APIs and adjusts the number of replicas accordingly.
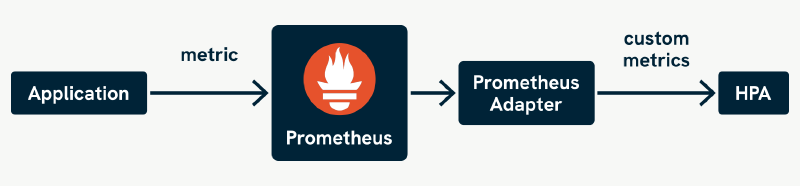
Example Workflow
Here’s a simple flow to illustrate how these components would work together with Prometheus:
- Your application exposes a metric like
http_requests_per_secondat/metrics. - Prometheus scrapes the endpoint and stores the data.
- The Prometheus Adapter maps this metric to the Kubernetes metrics API.
- The HPA fetches the metric and adjusts the number of pods as needed.
Example: HPA Using a Custom Metric
Below is an example HPA manifest that scales a deployment based on a custom metric called http_requests_per_second:
apiVersion: autoscaling/v2
kind: HorizontalPodAutoscaler
metadata:
  name: my-app-hpa
  namespace: default
spec:
  scaleTargetRef:
    apiVersion: apps/v1
    kind: Deployment
    name: my-app
  minReplicas: 1
  maxReplicas: 10
  metrics:
  - type: Pods
    pods:
      metric:
        name: http_requests_per_second
      target:
        type: AverageValue
        averageValue: 100
This configuration tells Kubernetes to maintain an average of 100 HTTP requests per second per pod.
The exact steps for setting up custom metrics will vary depending on your monitoring system, but they typically follow a similar pattern:
- Install your monitoring system (such as Prometheus, Datadog Agent, GCP Stackdriver).
- Expose metrics in your application using the appropriate client libraries or integrations.
- Deploy and configure the appropriate metrics adapter, mapping queries from your monitoring tool to Kubernetes metrics.
- Create an HPA resource that references the custom metric you want to scale on.
We’ll walk through these steps using Prometheus in the next post.
Verifying Available Metrics
To confirm that your metrics are available to the HPA, you can query the Custom Metrics API directly:
kubectl get --raw "/apis/custom.metrics.k8s.io/v1beta1" | jq .
If your metric appears in the output, it’s ready to be used in an HPA configuration.
Beyond HPA: When to Consider KEDA
While the Horizontal Pod Autoscaler (HPA) combined with metrics adapters is powerful, it has some limitations, especially when dealing with event-driven workloads or complex external integrations. This is where KEDA (Kubernetes Event-Driven Autoscaling) comes in.
KEDA extends Kubernetes autoscaling capabilities by enabling scale-to-zero and supporting a wide range of external scalers (including Azure Monitor, Kafka, RabbitMQ, AWS SQS, and more). Unlike HPA, which is limited to metrics APIs and polling intervals, KEDA supports event-driven scaling based on queue length, message counts, or other triggers.
KEDA might be a better fit if:
- You need scale-to-zero for idle workloads.
- You’re working with external systems not easily exposed as metrics.
- You want to respond to events or spikes more quickly than typical HPA polling intervals.
- Your monitoring solution lacks an HPA-compatible adapter (for example, the AWS CloudWatch adapter is deprecated).
KEDA can run alongside HPA and even manage HPA objects under the hood. If you’re building highly dynamic or event-driven systems, especially in serverless or microservice architectures, KEDA may offer a more flexible and scalable solution.
We also have a dedicated blog series on getting started with KEDA, covering real world use cases and setup tips. Check it out if you’re curious about how KEDA can fit into your stack.
Looking Ahead
In the next post in this series, we’ll dive into practical examples that walk you through setting up a custom metrics pipeline in a Kubernetes cluster using Prometheus and its adapter.
You’ll learn how to install, configure, and validate your setup so custom and external metrics flow correctly into your autoscaling configuration.
Final Thoughts
With the right monitoring setup and metrics adapter, Kubernetes autoscaling becomes intelligent rather than merely reactive. You are no longer restricted to CPU and memory usage — you can scale based on the metrics that truly reflect your application’s needs.
With the right setup, scaling becomes not merely reactive, but intelligent. Your monitoring system gives you the visibility, the adapter makes it actionable, and Kubernetes does the rest.
This blog is part of our Horizontal Pod Autoscaling series, we recommend reading the rest of the posts in the series:
- Introduction to Horizontal Pod Autoscaling in Kubernetes
- How to use Custom & External Metrics for Kubernetes HPA
- Set up Kubernetes scaling via Prometheus & Custom Metrics
- Leveraging Kubernetes HPA and Prometheus Adapter