
Telepresence 2.0: Enhance Development with Open Source
Discover how Telepresence 2.0 streamlines development workflows for Kubernetes with open-source tools
Written by:
Published on:
Apr 26, 2021Last updated on:
Mar 23, 2026Let’s Explore Telepresence 2.0
We’ll be exploring the recently released Telepresence 2.0 by delving into its use cases for enabling a team-based local development workflow, as well as local application and cluster debugging.
Before we dive into the functionality of Telepresence itself, it will help to outline some of the typical experiences of debugging both applications running on Kubernetes, as well as Kubernetes itself.
How do I Debug in Kubernetes?
Kubernetes is a distributed container orchestration architecture that is built to facilitate application and resource scalability, control plane resilience, and portability between both on-premise and cloud platform environments; This is not new information, I know. However, it is for these same reasons that debugging any issues that present themselves within a cluster can become tedious. Again, due to its portable nature, we can only consider kubectl to be the one universal means of interacting with clusters locally.
With this in mind, there are a couple of known options for debugging on Kubernetes clusters:
- Port Forwarding
- Shell session on a running container
Because of the Kubernetes networking model, there are a number of ways in which pod networking can be implemented; The only requirement is that each pod within a cluster can communicate with all pods on all nodes without any requirement for NAT. This means that Kubernetes networking implementations can either network pods as part of the host network, network pods together as part of a network overlay, or as a hybrid of the two. This means, for cluster users, workloads in a cluster may not be directly routable from their local machine or a bastion instance on the Kubernetes cluster host network.
The following sections will go over each of these options, and how Telepresence improves on the usability of both options.
Port Forward
Create a session which forwards traffic directed to a specified port on your local machine (localhost:8080, for example) to a specified destination port on the named pod. The benefit of using port-forward is that it allows access to any debugging / dev toolkits installed on your local machine or bastion, but can be quite cumbersome if access to a number of services or ports in tandem is required.
For example, to open a connection between port 8080 on your local machine and a MongoDB Pod listening on port 27017 in a remote cluster using kubectl, you will require two terminal sessions. In the first terminal, run the kubectl port-forward and allow the process to run:
kubectl port-forward mongodb-primary-0 `8080:27017`
Then, in your second terminal, you can now connect to the remote MongoDB instance through localhost:8080 using your local mongosh:
mongosh --port 8080
Again, if connections to multiple Pods are required, this workflow can easily become untidy.
Shell on Running Container
Depending on the cluster introspection required, either get a shell to an existing service using by running a kubectl exec on the service’s configured command language interpreter (commonly bash or bin/sh) using:
kubectl exec -it cool-service -n dev -- bash
or if you have a preferred cluster troubleshooting toolkit (such as busybox), deploy the toolkit pod to the cluster and open a shell session using:
kubectl exec -it busybox -n dev -- bash
This can be useful if examination of a service’s filesystem state is required as part of debugging, but generally, this workflow can also be quite cumbersome if the only benefit this provides is enabling debugging workflows within the correct Kubernetes DNS networking scope.
So with these two existing workflows in mind, what can Telepresence bring to the table to improve this experience for us?
Debugging Workflows With Telepresence
One use-case for Telepresence allows us to get the best of both port-forwarding, and performing introspection within the context of a pod in the cluster. For the purposes of this blog we will be focusing on the recently released Telepresence 2.0, which has been rewritten in Golang with a new architectural model to support more sophisticated multi-developer team workflows.
Like kubectl port-forward, Telepresence is used to set up a two-way proxy between your local machine and a running container on a remote Kubernetes cluster. However, Telepresence does this slightly differently through the use of a remote agent on the cluster. When connecting to a remote cluster, if this remote agent (called Traffic Manager) does not exist, your local CLI will bootstrap this Traffic Manager service in the ambassador namespace.
telepresence connect
Connecting to traffic manager...
Connected to context default (https://api.k8s.demo:6443)
The Telepresence daemon is started on your local machine and connects to this remote agent, which will maintain the proxy connection to the remote cluster. This means that inter-Kubernetes DNS resolution now becomes available to us. We can test this out using standard networking tools, such as curl.
Probably the go-to for testing Kubernetes DNS in any cluster is the DNS record that I would consider the most important: The DNS record that allows workloads in a Kubernetes cluster to access the Kubernetes API itself. To facilitate this access to the API, this is implemented using a cluster-scoped DNS record that resolves to the host IPs for each Kubernetes node which runs controller and API processes. Because Kubernetes DNS records are created for Pod and Service objects, this DNS record is manifested as a Service called kubernetes that is always stored within the default namespace:
kubectl get svc -n default

# Example output:
NAME         TYPE        CLUSTER-IP   EXTERNAL-IP   PORT(S)   AGE
kubernetes   ClusterIP   10.43.0.1    <none>        443/TCP   24d
Again, this Service resolves API requests to the API by storing the IPs and ports for each Kubernetes controller within the Service’s corresponding Endpoints object; In clusters with a HA controller plane, the API server itself is active/active and does not require leader election, meaning all controller nodes can accept API requests:
kubectl describe svc kubernetes -n default

# Example output:
Name:              kubernetes
Namespace:         default
Labels:            component=apiserver
                   provider=kubernetes
Annotations:       <none>
Selector:          <none>
Type:              ClusterIP
IP:                10.43.0.1
Port:              https  443/TCP
TargetPort:        6443/TCP
Endpoints:         10.154.0.01:6443,10.154.0.02:6443,10.154.0.03:6443
So, because cluster-scoped DNS is proxied to the cluster, this means we can send requests to kubernetes cluster-local API endpoint, and these requests will be routed to the cluster. Although we have received a 401 Unauthorized response, this is an expected response as we have not included any authentication HTTP headers for the API to process, but we are able to demonstrate that the API server is receiving our requests:
curl https://kubernetes.default:443 -k
Example output:
{
  "kind": "Status",
  "apiVersion": "v1",
  "status": "Failure",
  "message": "Unauthorized",
  "reason": "Unauthorized",
  "code": 401
}
Telepresence also allows us to use other utilities that are a part of our ops workflow such as nslookup from our local machine to debug Kubernetes networking. Again, from our local machine, we can validate cross-namespace DNS resolution is as expected within a cluster:
nslookup kubernetes.default

# Example output:
Server:    172.30.64.1
Address:   172.30.64.1#53

Name:   kubernetes.default
Address: 10.43.0.1
So under the hood, the general workflow for creating the Telepresence proxy to the remote cluster is:
- If not already, the local Telepresence Daemon is started on the local machine
- Using the current context stored in the configure local machine kubeconfig, Telepresence attempts to connect to Traffic Manager service running
ambassadornamespace in the remote cluster - If not already, an instance of Traffic Manager is installed in the
ambassadornamespace in the remote cluster - The proxy connection is created between local Daemon and Traffic Manager
Although the proxying provided by Telepresence is very useful, debugging Kubernetes clusters isn’t even the primary intended use-case as developed by Ambassador Labs. Telepresence’s “secret sauce” is application debugging, which we will explore next.
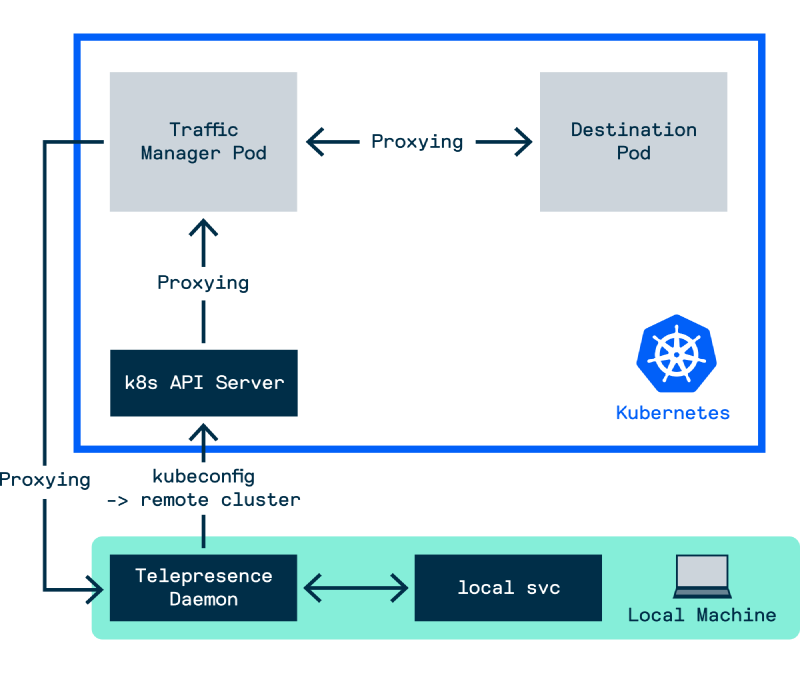
Figure - Telepresence Workflow 1
How do I Develop Applications on Kubernetes?
The shift from running production applications from monolithic architectures to distributed microservice architectures is one which can provide well documented benefits to businesses as a whole; So called “cloud native” microservices are built to live in ephemeral environments that can scale in response to changing resource requirements, and are built and tested within environments which are defined declaratively as code. Organisations often require internal platforms to facilitate the infrastructures needed to create and maintain the glue needed to allow new service updates to make its way to production. One element that’s particularly difficult to reconcile with a remote platform is the developer experience; How can we ensure that there is a level of confidence that changes being produced in dev will behave exactly the same when we push these to production?
There are two major paradigms for developing applications destined to run in on Kubernetes:
- Developing and deploying testing changes to a dev environment on a local machine. This could mean running application stacks in Docker configured with Compose files, or running a Kubernetes cluster locally, either within a VM (Minikube) or in Docker (kind / k3d / MicroK8s).
- Developing and deploying testing changes to a dev environment within a remote Kubernetes cluster. CI/CD pipelines may be in place to perform automated testing prior to the reconciling the remote cluster with latest application build.
Each of these methodologies are a double-edged sword, mainly:
- Developing locally may require testing against the full application architecture; The resource overhead needed to run a Kubernetes cluster and the application stack on a local machine may be too excessive. It is also easier to maintain a smaller parity between dev and production environments if both are run on the same platform, where to enable applications to run on local hardware may require additional configuration drift, and ongoing maintenance of this configuration.
- Developing remotely will introduce additional waiting periods between the submission of new code to test and code reconciliation in the remote dev environment, potentially reducing productivity. If using a shared development environment, this makes it difficult for multiple individuals to work concurrently on the same codebase. Conversely, allocating individual remote development environments may incur an additional monetary overhead.
Solving this problem is where Telepresence comes in. We will go through two example workflows which you can use to debug an application on a remote Kubernetes cluster, depending on your use-case; One which works best for a dev environment in use by a single developer, and one which would better benefit a development team sharing a dev environment. At its core both of the dev workflows we’ll be describing utilise Telepresence “intercepts” to rewrite traffic flow for services.
Single Dev Workflow
Mimicking the intercept logic previously available in the “classic” Telepresence 1.0, this intercept workflow operates under the assumption that once an intercept has been created for a application, then all traffic to that service should be rerouted through the intercept to the target machine that initiated the intercept. This is the default intercept behaviour that is performed if Telepresence has not been configured with an Ambassador Cloud login. Using the example Golang application provided by Ambassador Labs, we’ll walkthrough how this can be achieved.
Clone the example Golang application provided by Ambassador Labs
git clone https://github.com/datawire/edgey-corp-go.git
Navigate to the path containing the DataProcessingService application, and build and run this application on your local machine. Confirm the application is running and listening on port 3000 as expected using curl localhost:3000/color, and confirm the output is green
git clone https://github.com/datawire/edgey-corp-go.git
cd edgey-corp-go/DataProcessingService
go build main.go && ./main
Use Telepresence to connect to the remote cluster; One thing to note is that, if an Ambassador Cloud login config has been configured, the --preview-url=false (or telepresence connect --preview-url=false) will need to be provided to prevent the creation of Preview URLs
telepresence connect
Example output:
Launching Telepresence Daemon v2.1.5 (api v3)
Need root privileges to run "/usr/local/bin/telepresence daemon-foreground /home/louise/.cache/telepresence/logs '' ''"
[sudo] password for louise:
Connecting to traffic manager...
Connected to context default-terraform (https://api.k8s.demo:6443)
Confirm that the Traffic Manager remote agent is running as expected
kubectl get pods -n ambassador
NAME                               READY   STATUS    RESTARTS   AGE
traffic-manager-7f87594788-fk2mm   1/1     Running   0          15m
Deploy the example application to the cluster
kubectl create ns telepresence-demo
kubectl apply -f  ../k8s-config/edgey-corp-web-app-no-mapping.yaml -n telepresence-demo
Once the pods are running, confirm that Telepresence is able to intercept these applications
telepresence list -n telepresence-demo
dataprocessingservice: ready to intercept (traffic-agent not yet installed)
verylargedatastore   : ready to intercept (traffic-agent not yet installed)
verylargejavaservice : ready to intercept (traffic-agent not yet installed)
Also confirm that you are able to interact with the remote dataprocessingservice service using curl
curl dataprocessingservice.telepresence-demo:3000/color

# Example output:
"green"
Now instruct Telepresence to intercept all requests to the remote dataprocessingservice
telepresence intercept dataprocessingservice -n telepresence-demo -p 3000
Using Deployment dataprocessingservice
intercepted
    Intercept name    : dataprocessingservice-telepresence-demo
    State             : ACTIVE
    Workload kind     : Deployment
    Destination       : 127.0.0.1:3000
    Volume Mount Point: /tmp/telfs-886957741
    Intercepting      : all TCP connections
You can confirm this has been done by performing another telepresence list
telepresence list -n telepresence-demo
dataprocessingservice: intercepted
    Intercept name: dataprocessingservice-telepresence-demo
    State         : ACTIVE
    Workload kind : Deployment
    Destination   : 127.0.0.1:3000
    Intercepting  : all TCP connections
verylargedatastore   : ready to intercept (traffic-agent not yet installed)
verylargejavaservice : ready to intercept (traffic-agent not yet installed)
If you curl the dataprocessingservice, you should get back the same result if the intercept is working correctly. Now we’re in a position to start applying changes to the local application, and inspect how this affects the result returned by the dataprocessingservice remote service
curl dataprocessingservice.telepresence-demo:3000/color

# Example output:
"green"
Now stop the local dataprocessingservice go application and change the value of the env string to blue
package main

import (
  "encoding/json"
  "flag"
  "fmt"
  "io/ioutil"
  "net/http"
)

var color string = "blue"
var env string = "local"
var datastoreURL string = "http://verylargedatastore:8080"
var port string = "3000"
Finally, restart the golang service locally
cd ../edgey-corp-go/DataProcessingService
go build main.go && ./main
If you curl the dataprocessingservice now, the value returned from querying its /color endpoint will now be blue. We’ve successfully deployed a change to the cluster in the portion of the time it would otherwise take to build and push a new image, and deploy a modified Kubernetes deployment referencing the new image!
curl dataprocessingservice.telepresence-demo:3000/color
"blue"
So under the hood, the general workflow for the intercept is:
- Request sent to the Traffic Manager to create an intercept for a named Pod
- Specified Pod is injected with a Traffic Agent sidecar, inject in turn injects network rules to ensure that all inbound and outbound traffic for the Pod is redirected through the Traffic Agent
- All inbound requests to the named Pod will be intercepted by the Traffic Agent sidecar, which will by default route that request to the Traffic Manager, and finally routed to the Telepresence Daemon configured in the intercept
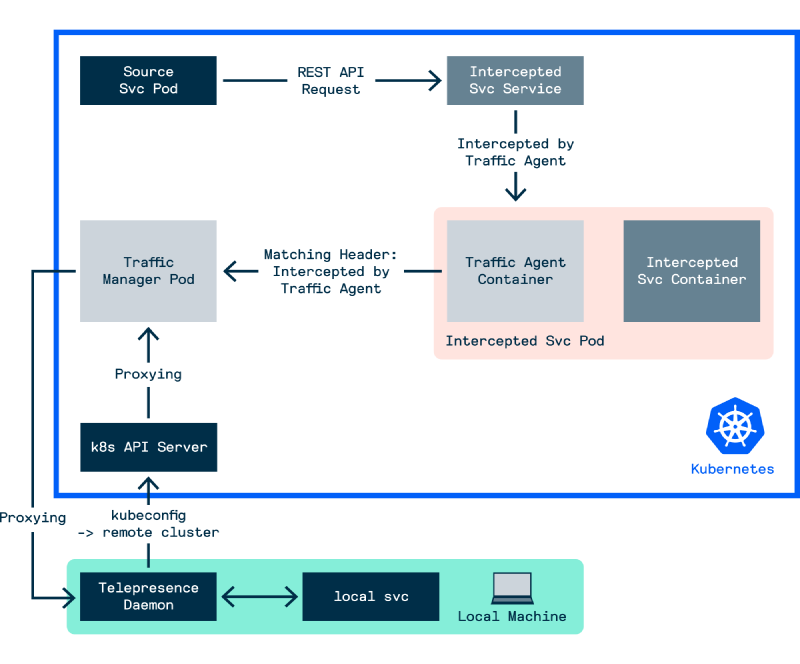
Figure - Telepresence Workflow 2
Although this workflow reduces the amount of time lost spent waiting for a new change to deploy to the remote cluster, because all traffic to the remote service is now rerouted to the local service, and any service at any time can be replaced with a version running on a developer’s local machine, this introduces a new issue when developing and testing services. Thankfully, Telepresence 2.0 can address this use-case.
Multi Dev / Team Workflow
So, in a shared dev environment where individual devs may need their application to perform external API calls to other services in the environment, there is a requirement that these external services should remain somewhat stable, to ensure that there is a level of confidence that a feature or bug fix being developed will behave as expected when promoted up to QA or staging.
In addition to intercepting all traffic for a service, Telepresence 2.0 provides the option to create an intercept that will reroute requests to a local service if specified within the HTTP request. This essentially allows multiple versions of a service to run simultaneously; New features and bug fixes can be developed on that service without impacting other developers’ ability to test their service against a known, stable version of the dev microservice architecture.
So how can we enable this functionality? There are a number of mechanisms in place we could potentially use. To help make this workflow as seamless as possible, Ambassador Cloud integration has been added to Telepresence to develop a feature called preview URLS. Preview URLs are externally accessible intercepts, ephemeral domain names hosted by Ambassador Cloud which forward requests to the intercepted service on the Kubernetes cluster through that cluster’s ingress. Because these preview URLs could be considered conditional intercepts, only requests which reach the intercepted service through the preview URL will be redirected to the local service. All other service traffic will be routed to the service workload in the cluster as normal.
Preview URLs are clearly a useful feature, but we aren’t reliant on generating preview URLS in Ambassador Cloud to enable the conditional intercept workflow. The reason for this is that, at its heart, this proxying logic is localised to Traffic Manager, which facilitates communication between intercepted services in the cluster and connected Telepresence daemons on local machines. This is because the preview URL / intercept workflow localised within the context of the cluster is as follows:
- Ensure that client-side (Telepresence daemon) and server-side agents (Traffic Manager) are both started
- Traffic Manager opens and maintains a proxy connection between itself and Telepresence daemons on local machines
- Traffic Manager, through the Kubernetes API, injects a Traffic Agent container as a sidecar to live Pods which are served by the Service name defined during the intercept
- IP tables rules are defined within the Pod to redirect all incoming Pod traffic to the Traffic Agent
- Depending on the intercept filter defined, the Traffic Agent will either forward the request to the service container as normal, or route the request to the Traffic Manager to forward to the local machine
What this means is that, although Telepresence seems to require creating and logging into a free Ambassador Cloud account, bespoke intercepts can be created by any developer on any service, with no interruption to the workflow of other developers working in the same environment. We’ll show an example of how we can achieve this.
First, remove any previous intercepts you’ve set up and reconnect Telepresence to the cluster
telepresence uninstall --everything
telepresence connect
This time, we’ll create an intercept on the dataprocessingservice service, but we’ll define an additional header within the Traffic Agent using the --http-match flag. When defined, the Traffic Agent in the dataprocessingservice Pod will inspect and check if incoming service requests match the specified HTTP header key/value. If no HTTP header is defined and you are not logged into Ambassador Cloud, this will be the equivalent of --http-match=all. Again, defining a custom HTTP header will require logging into the Ambassador Cloud service with a free user account
In this example, we’ll provide a HTTP header key/value of blog-demo-id=louise
telepresence intercept dataprocessingservice -n tele-test -p 3000 --http-match="blog-demo-id=louise"
Launching browser authentication flow...
Could not open browser, please access this URL: https://auth.datawire.io/auth?client_id=telepresence-cli&code_challenge=PiP4Lhu7cGse1AUZEMwpDLiXa_ytwDv9r5h9u5m1gdM&code_challenge_method=S256&redirect_uri=http%3A%2F%2Flocalhost%3A43887%2Fcallback&response_type=code&scope=openid+profile+email&state=80aba095-a994-4144-85ca-f4cd93a83123
Login successful.

Connected to context default-terraform (https://api.k8s.demo:6443)
Using Deployment dataprocessingservice
intercepted
    Intercept name: dataprocessingservice-tele-test
    State         : ACTIVE
    Workload kind : Deployment
    Destination   : 127.0.0.1:3000
    Intercepting  : HTTP requests that match all of:
      header("blog-demo-id") ~= regexp("louise")
Assuming the dataprocessingservice with our custom /color endpoint logic is still running on your local machine, when the intercept has been set up, we can confirm this intercept doesn’t impact on standard traffic to dataprocessingservice
curl dataprocessingservice.tele-test:3000/color

# Example output
"green"
However, if we inject our request with the blog-demo-id=louise HTTP header that matches the regex defined in our intercept, we can confirm the expect response from the /color endpoint
curl -H "blog-demo-id: louise" dataprocessingservice.tele-test:3000/color

# Example
"blue"
So under the hood, the general workflow for the customised intercept is:
- Request sent to the Traffic Manager to create an intercept for a named Pod for HTTP requests with headers that match all provided header key/values
- Specified Pod is injected with a Traffic Agent sidecar, inject in turn injects network rules to ensure that all inbound and outbound traffic for the Pod is redirected through the Traffic Agent
- All inbound requests to the named Pod will be intercepted by the Traffic Agent sidecar. The Traffic Agent will inspect the headers for inbound requests
- If all specified headers are matched, the request will be routed to the Traffic Manager, and finally routed to the Telepresence Daemon configured in the intercept
- Otherwise, the request is routed to the intercepted service container in the same Pod
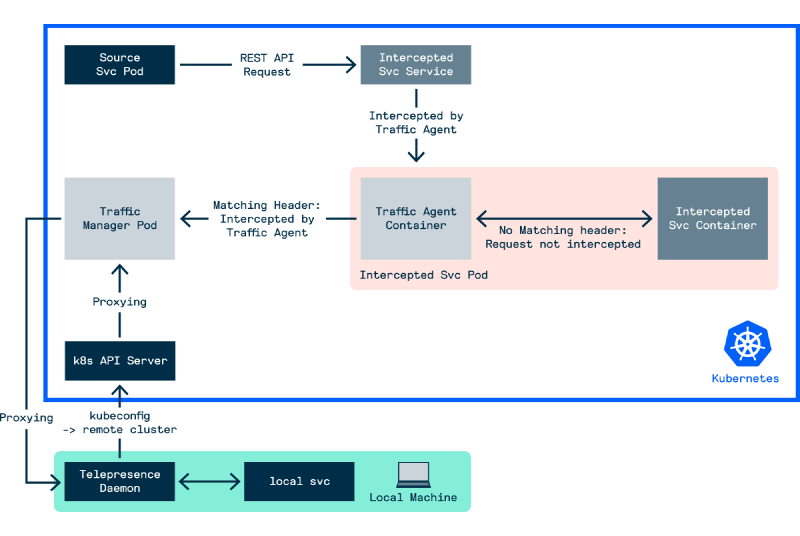
Figure - Telepresence Workflow 3
Although this workflow as discussed here can clearly be very useful, it would be most effective when part of an agreed company development workflow. We will leave this blog here for now, but we are excited by the potential Telepresence can provide us both internally and for our customers. If you would like to discuss Telepresence further with a Cloud Platform Engineer, book a meeting on our homepage.