
Introduction to Horizontal Pod Autoscaling in Kubernetes
How to configure Horizontal Pod Autoscaling in Kubernetes for responsive, efficient scaling
Written by:
Published on:
Last updated on:
This blog is part of our Horizontal Pod Autoscaling series, we recommend reading the rest of the posts in the series:
- Introduction to Horizontal Pod Autoscaling in Kubernetes
- How to use Custom & External Metrics for Kubernetes HPA
- Set up Kubernetes scaling via Prometheus & Custom Metrics
- Leveraging Kubernetes HPA and Prometheus Adapter
What is Horizontal Pod Autoscaling?
In Kubernetes, Horizontal Pod Autoscaling (HPA) is a mechanism that dynamically adjusts the number of pod replicas in a deployment or replica set based on observed performance metrics. It helps maintain the responsiveness, resilience, and efficiency of your applications running on a cluster. By dynamically scaling pods to match demand, HPA ensures services remain both resilient and cost-effective.
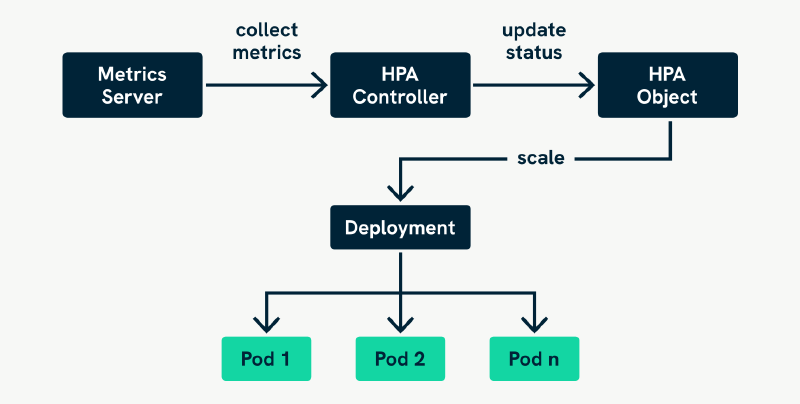
At its core, the HPA is simply another Kubernetes object, much like a Deployment, Service, or ConfigMap. It is defined using a YAML manifest, similar to other Kubernetes resources, and lives in a namespace within your cluster, just like any other namespaced resource. Once applied to the cluster using kubectl apply or a CI/CD pipeline, the HPA controller (built into the Kubernetes control plane) begins monitoring the specified target resource, typically a Deployment, and adjusts the number of replicas based on configured metrics.
How HPA Works: The Basics
The HPA operates as a control loop, a recurring process that monitors performance and adjusts replicas accordingly, and one of several types of controllers in a Kubernetes cluster. At regular intervals, it queries metrics for the pods during its watch. These metrics are typically gathered from the Metrics Server, a lightweight cluster-wide component that provides CPU and memory usage data. HPA then compares the current observed values against a target defined in the HPA configuration. Based on how far off the current usage is from the desired state, HPA decides whether to increase, decrease, or maintain the number of pods.
Let’s start with the more traditional form of autoscaling using CPU metrics. Suppose you have a Deployment with pods configured as follows:
apiVersion: apps/v1
kind: Deployment
metadata:
  name: my-app
  namespace: default
  labels:
    app: my-app
spec:
  replicas: 2
  selector:
    matchLabels:
      app: my-app
  template:
    metadata:
      labels:
        app: my-app
    spec:
      containers:
        - name: my-app-container
          image: myregistry/my-app:latest
          ports:
            - containerPort: 8080
          resources:
            requests:
                cpu: 25m
            limits:
                cpu: 100m
Let’s assume the target average CPU utilisation is 50%. Since each pod is limited to 100 millicores (m), the target usage would be 50m per pod. Imagine your Deployment is currently running five pods with a combined CPU load of 240m. This works out to an average of 48m per pod, or 48% utilisation, so no action is needed.
But now imagine a spike in traffic pushes the combined CPU load up to 350m. That’s 70m per pod on average, or 70% utilisation. The HPA will respond by increasing the number of pods, likely adding two more, to distribute the load more evenly and bring the average back down to the 50% target.
To implement this behaviour, you can define a Horizontal Pod Autoscaler using a Kubernetes manifest like the one below:
apiVersion: autoscaling/v2
kind: HorizontalPodAutoscaler
metadata:
  name: my-app-hpa
  namespace: default
spec:
  scaleTargetRef:
    apiVersion: apps/v1
    kind: Deployment
    name: my-app
  minReplicas: 2
  maxReplicas: 10
  metrics:
    - type: Resource
      resource:
        name: cpu
        target:
          type: Utilization
          averageUtilization: 50
In this manifest:
scaleTargetRefpoints to the Deployment we want to scale (my-app).minReplicasandmaxReplicasdefine the allowed range for scaling.- Under
metrics, we specify the metric type (Resource) and name (cpu), and set the desired target: an average CPU utilisation of 50%.
The averageUtilization in HPA is based on the requested CPU, not the limit. For example, if each pod requests 100m CPU and the target is set to 50%, then HPA will try to maintain an average CPU usage of 50m per pod. If the actual average usage goes above or below that threshold, the HPA calculates how many replicas would be needed to bring it back in line. The limits field does not affect HPA calculations, it merely caps container usage, but isn’t considered when scaling.
The formula Kubernetes uses for this is roughly desiredReplicas = currentReplicas x (currentMetric / desiredMetric).
So if each pod is using 70m and the target is 50m, the HPA will increase the number of pods accordingly to bring the average back down. Conversely, if average usage drops below the target, HPA may scale down to conserve resources.
By defining the HPA as a resource within your cluster, you can version it, store it in Git, and manage it alongside the rest of your infrastructure using GitOps or CI/CD pipelines. It’s declarative, repeatable, and behaves just like any other Kubernetes-native object.
This kind of reactive, metric-driven scaling is one of Kubernetes’ most powerful features, ensuring your application can gracefully handle both calm and stormy seas.
Container Resource Metrics: A More Granular Option
While type: Resource scaling works well in many cases, it does have limitations, especially in more complex deployments that include multiple containers per pod (such as sidecars for logging, service meshes, or proxies). In those situations, it can be difficult to isolate which container’s resource usage should influence scaling.
This is where container resource metrics come in.
The HPA controller supports type: ContainerResource, a stable feature since Kubernetes v1.27. This allows you to target a specific container by name within a pod and make scaling decisions based solely on its resource usage.
Here’s how that works in practice:
apiVersion: autoscaling/v2
kind: HorizontalPodAutoscaler
metadata:
  name: my-app-hpa
  namespace: default
spec:
  scaleTargetRef:
    apiVersion: apps/v1
    kind: Deployment
    name: my-app
  minReplicas: 2
  maxReplicas: 10
  metrics:
    - type: ContainerResource
      containerResource:
        name: cpu
        container: my-app-container
        target:
          type: Utilization
          averageUtilization: 50
In this manifest:
type: ContainerResourcespecifies that the HPA should only consider resource usage from the named container (my-app-container).- Just like with the traditional method, usage is compared to the resource request, not the limit.
- Containers that are not named (such as sidecars) are completely excluded from the calculation.
This approach gives you fine-grained control and ensures that the HPA responds only to the container that truly matters for performance and scalability.
How the Metrics Are Calculated
Whether you’re using Resource or ContainerResource, it’s important to understand how Kubernetes interprets resource usage:
- CPU usage is measured in millicores (for example, 100m = 0.1 cores).
- Utilisation targets are percentages of the container’s or pod’s requested CPU or memory.
- Only containers with defined
resources.requestsare included in the calculation. If a container doesn’t request CPU, it won’t factor into scaling decisions, even if it uses significant CPU.
For example, in a pod with two containers:
containers:
  - name: my-app-container
    image: myregistry/my-app:latest
    resources:
      requests:
        cpu: 100m
  - name: sidecar
    image: log-agent:latest
If using type: Resource, only the app container will be considered in the average CPU utilisation across pods. If using type: ContainerResource, you can be even more explicit and ensure only app is evaluated.
This added precision helps avoid scenarios where a noisy or idle sidecar skews your scaling logic.
The Limitations of Default CPU/Memory-Based Autoscaling
While the default HPA setup based on CPU and memory usage works well for many basic scenarios, it has clear limitations, particularly in real-world applications where usage patterns are more complex or performance bottlenecks don’t neatly correlate with CPU load.
CPU and memory metrics are broad system-level indicators. They can be good signals in compute-heavy workloads like video encoding or scientific computations, but they often fail to reflect actual user demand or application-specific load in many modern systems.
For instance, a web application during heavy traffic might use only moderate CPU, especially if it performs mostly I/O-bound tasks such as querying databases or calling external APIs. In such a case, the HPA might see no reason to scale, even though end-users are experiencing delays and the system is clearly under pressure.
Moreover, applications that rely on background queues (like job workers consuming tasks from Kafka, RabbitMQ, or AWS SQS) may exhibit low CPU usage even when those queues are backing up, an early sign that the system needs more workers to keep up. CPU usage in such a context simply doesn’t tell the full story.
Another limitation lies in the granularity and flexibility of the built-in metrics. Kubernetes Metrics Server offers a narrow view, essentially just CPU and memory. These are insufficient for applications that need to scale based on domain-specific behaviours. That’s where custom and external metrics come in.
Built-in Metrics vs Custom & External Metrics
Kubernetes supports two primary types of metrics for autoscaling:
- Built-in metrics: These include CPU and memory utilisation, collected via the Metrics Server. They are easy to use and sufficient for simple use cases.
- Custom & External metrics: These are defined by the user or application and can include any measurable aspect of the system, request rate, error rate, queue depth, latency, throughput, etc.
The Custom Metrics and External Metrics APIs enables HPA to query these more specific metrics, typically via monitoring tools like Prometheus. These are often used in conjunction with an adapter such as the Prometheus Adapter. This opens the door to much more intelligent, context-aware autoscaling strategies.
Why Custom Metrics Matter: Real-World Examples
Let’s explore a few real-world scenarios where custom metrics significantly improve the effectiveness of horizontal pod autoscaling.
Queue Length
Imagine a background job worker that pulls messages off a queue (such as Kafka or SQS). If the queue starts growing longer, it indicates that the existing workers can’t keep up. This is a clear signal to scale out.
However, since these workers are often I/O-bound (such as making database writes or HTTP calls), their CPU usage might remain low. Relying on CPU in this case would result in no autoscaling at all, despite growing latency and operational risk. By using queue length as a custom metric, you can scale your workers based on the actual pressure they’re experiencing.
Request Rate
For APIs and frontend services, the number of incoming requests per second (RPS) is often a far better signal of workload than CPU usage. High RPS usually correlates with more concurrent connections, more data processing, and more overall pressure on the application.
You could set up a Prometheus query to expose RPS as a custom metric and use that to guide pod scaling. This helps ensure your service scales in line with actual demand, not just incidental CPU load.
Latency and Error Rates
In some cases, you may wish to scale based on performance degradation, such as an increase in response times or error rates. For example, if 95th percentile latency exceeds a certain threshold, you may want to scale out proactively, before user experience is impacted.
This is especially useful for services with strict SLAs or customer-facing APIs where performance is a critical requirement or competitive differentiator.
Summary: Smarter Scaling Starts With Smarter Metrics
Horizontal Pod Autoscaling is a foundational feature of Kubernetes, and a key building block for responsive, resilient infrastructure. It allows your applications to automatically adapt to load, stay cost-efficient, and avoid unnecessary downtime.
With the introduction of container resource metrics, Kubernetes now offers a more accurate, nuanced way to perform autoscaling, especially in workloads with sidecars, proxies, or non-uniform containers. This makes HPA more flexible and better aligned with modern application patterns. But as powerful as it is, default CPU and memory-based autoscaling is often too blunt an instrument for today’s distributed, event-driven systems.
By incorporating custom metrics, you can design scaling logic that truly reflects how your application experiences load. Whether it’s the depth of a queue, the rate of incoming requests, or a bespoke performance indicator, these metrics allow your autoscaling policies to be not just reactive, but intelligent and adaptive.
In the end, HPA isn’t just about scaling pods, it’s about aligning infrastructure with application reality. And custom metrics are how you make that connection.
Extra Links
This blog is part of our Horizontal Pod Autoscaling series, we recommend reading the rest of the posts in the series:
- Introduction to Horizontal Pod Autoscaling in Kubernetes
- How to use Custom & External Metrics for Kubernetes HPA
- Set up Kubernetes scaling via Prometheus & Custom Metrics
- Leveraging Kubernetes HPA and Prometheus Adapter